Sony 2007 Annual Report Download - page 82
Download and view the complete annual report
Please find page 82 of the 2007 Sony annual report below. You can navigate through the pages in the report by either clicking on the pages listed below, or by using the keyword search tool below to find specific information within the annual report.-
 1
1 -
2
-
3
-
4
-
5
-
6
-
7
-
8
-
9
-
10
-
11
-
12
-
13
-
14
-
15
-
16
-
17
-
18
-
19
-
20
-
21
-
22
-
23
-
24
-
25
-
26
-
27
-
28
-
29
-
30
-
31
-
32
-
33
-
34
-
35
-
36
-
37
-
38
-
39
-
40
-
41
-
42
-
43
-
44
-
45
-
46
-
47
-
48
-
49
-
50
-
51
-
52
-
53
-
54
-
55
-
56
-
57
-
58
-
59
-
60
-
61
-
62
-
63
-
64
-
65
-
66
-
67
-
68
-
69
-
70
-
71
-
 72
72 -
 73
73 -
 74
74 -
 75
75 -
 76
76 -
 77
77 -
 78
78 -
 79
79 -
 80
80 -
 81
81 -
 82
82 -
 83
83 -
 84
84 -
 85
85 -
 86
86 -
 87
87 -
 88
88 -
 89
89 -
 90
90 -
 91
91 -
 92
92 -
93
-
94
-
95
-
96
-
97
-
98
-
99
-
100
-
101
-
102
-
103
-
104
-
105
-
106
-
107
-
108
-
109
-
110
-
111
-
112
-
113
-
114
-
115
-
116
-
117
 |
 |

79
CONDENSED STATEMENTS OF CASH FLOWS
Yen in millions
Sony without
Financial Services Financial Services Consolidated
Years ended March 31 2006 2007 2006 2007 2006 2007
Net cash provided by operating activities . . . . . . . . . . . . . . . . . . .
147,149 256,540 251,975 305,571 399,858 561,028
Net cash used in investing activities . . . . . . . . . . . . . . . . . . . . . . .
(563,753) (276,749) (296,376) (431,086) (871,264) (715,430)
Net cash provided by financing activities . . . . . . . . . . . . . . . . . . .
274,863 179,627 74,600 59,598 359,864 247,903
Effect of exchange rate changes on cash and cash equivalents . .
——35,537 3,300 35,537 3,300
Net increase (decrease) in cash and cash equivalents . . . . . . . . .
(141,741) 159,418 65,736 (62,617) (76,005) 96,801
Cash and cash equivalents at beginning of the fiscal year . . . . . .
259,371 117,630 519,732 585,468 779,103 703,098
Cash and cash equivalents at end of the fiscal year . . . . . . . . . . .
117,630 277,048 585,468 522,851 703,098 799,899
consolidated financial statements. Transactions between the
Financial Services segment and all other segments excluding
the Financial Services segment are eliminated in the consolidated
figures shown below.
LIQUIDITY AND CAPITAL RESOURCES
Sony’s financial policy is to maintain the strength of its balance
sheet, while securing adequate liquidity for business expenses.
Sony intends to continue various investments for future
growth. Funding requirements that arise from its business
strategy are principally covered by free cash flow generated from
business operations and by cash and cash equivalents (“cash
balance”); however as needed, Sony will procure funds from the
financial and capital markets. For these financing activities,
Sony has sufficient access to financial and capital markets as
described below. In addition, to sustain sufficient liquidity, Sony
has committed lines of credit with financial institutions, together
with cash balances.
The description below covers liquidity and capital resources
for consolidated Sony and excludes the Financial Services
segment, which secures liquidity on its own.
MARKET ACCESS
Sony Corporation and SGTS, a finance subsidiary in the U.K.,
procure funds from the financial and capital markets.
In order to meet long-term funding requirements, Sony
Corporation utilizes its access to global equity and bond
markets and borrowings from financial institutions. During the
fiscal year ended March 31, 2007, Sony Corporation issued an 80
billion yen syndicated loan in June 2006 (3 years maturity), and a
130 billion yen syndicated loan in December 2006 (4 years and 7
years maturity), for general corporate purposes including capital
expenditures, and debt redemption. Sony Corporation maintains
a bond shelf registration of 300 billion yen filed in Japan, effective
until April 2008; however Sony Corporation has not issued a
bond using this shelf registration during the fiscal year ended
March 31, 2007.
In order to meet the working capital requirements of Sony,
SGTS maintains commercial paper (“CP”) programs and a
medium-term note (“MTN”) program. SGTS maintains CP
programs for the U.S., Euro and Japanese CP markets. As of
March 31, 2007, the total maximum amount to be issued under
these CP programs, translated into yen, was 1,326.6 billion
yen. During the fiscal year ended March 31, 2007, the largest
month-end outstanding balance of CP was 348.2 billion yen in
November 2006. There was no outstanding balance of CP as of
March 31, 2007.
SGTS maintains a Euro MTN program with a program limit
amount, translated into yen as of March 31, 2007, of 590.5
billion yen. There was no outstanding balance as of that date.
LIQUIDITY MANAGEMENT
Sony’s working capital needs grow significantly in the third
quarter (from October to December) as a result of the general
seasonality of Sony’s business. Sony’s basic liquidity manage-
ment policy is to secure sufficient liquidity throughout the
relevant fiscal year, covering such factors as short-term cash
(Yen in billions)
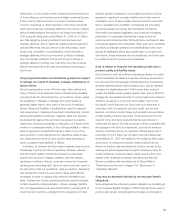
Depreciation and amortization
*Years ended March 31
*Including amortization
expenses for intangible assets
and for deferred insurance
acquisition costs
480
360
240
120
02005 2006 2007
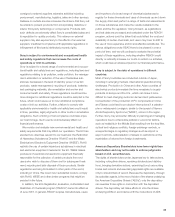
Capital expenditures
(additions to property,
plant and equipment)
*Years ended March 31
(Yen in billions)
480
360
240
120
02005 2006 2007