Sony 2007 Annual Report Download - page 70
Download and view the complete annual report
Please find page 70 of the 2007 Sony annual report below. You can navigate through the pages in the report by either clicking on the pages listed below, or by using the keyword search tool below to find specific information within the annual report.-
 1
1 -
2
-
3
-
4
-
5
-
6
-
7
-
8
-
9
-
10
-
11
-
12
-
13
-
14
-
15
-
16
-
17
-
18
-
19
-
20
-
21
-
22
-
23
-
24
-
25
-
26
-
27
-
28
-
29
-
30
-
31
-
32
-
33
-
34
-
35
-
36
-
37
-
38
-
39
-
40
-
41
-
42
-
43
-
44
-
45
-
46
-
47
-
48
-
49
-
50
-
51
-
52
-
53
-
54
-
55
-
56
-
57
-
58
-
59
-
 60
60 -
 61
61 -
 62
62 -
 63
63 -
 64
64 -
 65
65 -
 66
66 -
 67
67 -
 68
68 -
 69
69 -
 70
70 -
 71
71 -
 72
72 -
 73
73 -
 74
74 -
 75
75 -
 76
76 -
 77
77 -
 78
78 -
 79
79 -
 80
80 -
81
-
82
-
83
-
84
-
85
-
86
-
87
-
88
-
89
-
90
-
91
-
92
-
93
-
94
-
95
-
96
-
97
-
98
-
99
-
100
-
101
-
102
-
103
-
104
-
105
-
106
-
107
-
108
-
109
-
110
-
111
-
112
-
113
-
114
-
115
-
116
-
117
 |
 |
67
■PICTURES
Sales for the fiscal year ended March 31, 2007 increased by
220.4 billion yen, or 29.5 percent, to 966.3 billion yen compared
to the previous fiscal year. Operating income increased by 15.3
billion yen, or 55.7 percent, to 42.7 billion yen and the operating
margin increased from 3.7 percent to 4.4 percent. The results in
the Pictures segment consist of the results of Sony Pictures
Entertainment Inc. (“SPE”), a U.S.-based subsidiary.
On a U.S. dollar basis, sales for the fiscal year in the Pictures
segment increased approximately 26 percent and operating
income increased by approximately 53 percent. Sales increased
significantly due to higher worldwide theatrical and home
entertainment revenue from films released in the current fiscal
year, as compared to those released in the previous fiscal year.
Major films released in the fiscal year that contributed to both
theatrical and home entertainment revenue included The Da
Vinci Code, Casino Royale, Click, Talladega Nights: The Ballad
of Ricky Bobby and The Pursuit of Happyness. Sales for the
fiscal year release slate increased approximately 1.8 billion U.S.
dollars as compared to the previous fiscal year. Television
product revenues increased by approximately 160 million U.S.
dollars primarily as a result of higher advertising and subscription
sales from several international channels.
Operating income for the segment increased significantly,
primarily due to the performance of films released in the current
fiscal year. Operating loss from the current fiscal year release slate
decreased approximately 530 million U.S. dollars as compared to
the previous year’s release slate due to the same factors contrib-
uting to the increase in film revenue noted above. Partially
offsetting this was a decrease in operating income of 98 million
U.S. dollars for television product primarily due to the recording
of production and marketing expenses in the current fiscal year
associated with several new network and made-for-syndication
television shows, combined with the absence of a licensing
agreement extension for Wheel of Fortune, which was recognized
in the previous fiscal year. Results for the Pictures segment were
also negatively impacted by an adjustment to increase its reserve
for returns of home entertainment catalog product.
As of March 31, 2007, unrecognized license fee revenue at
SPE was approximately 1.1 billion U.S. dollars. SPE expects to
record this amount in the future having entered into contracts
with television broadcasters to provide those broadcasters with
completed motion picture and television products. The license
fee revenue will be recognized in the fiscal year in which the
product is made available for broadcast.
■FINANCIAL SERVICES
Note that the revenue and operating income at Sony Life, Sony
Assurance and Sony Bank discussed below on generally
accepted accounting principles in the U.S. (“U.S. GAAP”) basis
differ from the results that Sony Life, Sony Assurance and
Sony Bank disclose on a Japanese statutory basis.
Financial Services segment revenue for the fiscal year ended
March 31, 2007 decreased by 93.9 billion yen, or 12.6 percent,
to 649.3 billion yen compared with the previous fiscal year.
Operating income decreased by 104.2 billion yen, or 55.3
percent, to 84.1 billion yen and the operating income margin
decreased to 13.0 percent compared with the 25.3 percent of
the previous fiscal year.
At Sony Life, revenue decreased by 100.0 billion yen, or
15.5 percent, to 545.1 billion yen compared with the previous
fiscal year. Although revenue from insurance premiums increased
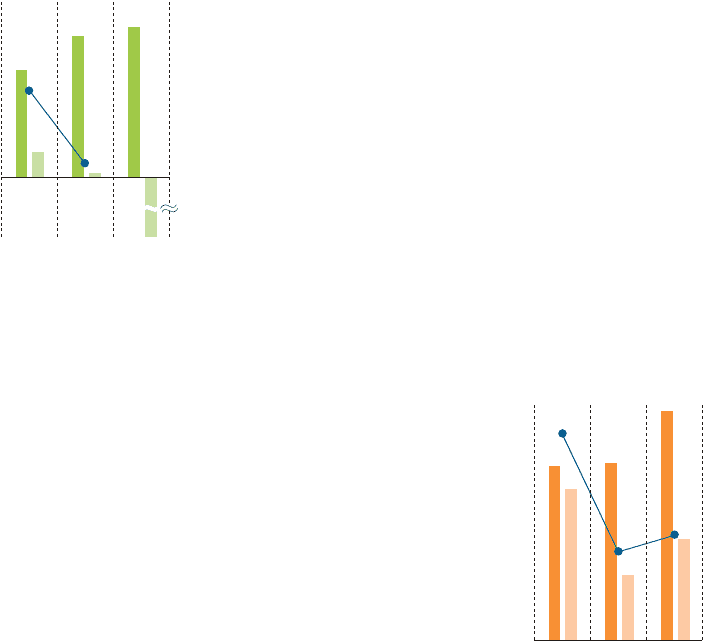
at Sony Life reflecting an increase in insurance-in-force, the main
(Yen in billions)
Sales and operating income
(loss) in the Game segment
■ Sales (left)
■ Operating income (loss) (right)
● Operating margin
*Years ended March 31
1,200
800
400
0
300
200
100
0
–232.3
2005 2006 2007
5.9%
0.9%
(Yen in billions)
Sales and operating income in
the Pictures segment
■ Sales (left)
■ Operating income (right)
● Operating margin
*Years ended March 31
1,000
750
500
250
0
100
75
50
25
0
2005 2006 2007
8.7%
3.7%
4.4%
(Yen in billions) (Yen in billions)