Sony 2007 Annual Report Download - page 4
Download and view the complete annual report
Please find page 4 of the 2007 Sony annual report below. You can navigate through the pages in the report by either clicking on the pages listed below, or by using the keyword search tool below to find specific information within the annual report.-
 1
1 -
 2
2 -
 3
3 -
 4
4 -
 5
5 -
 6
6 -
 7
7 -
 8
8 -
 9
9 -
 10
10 -
 11
11 -
 12
12 -
 13
13 -
 14
14 -
 15
15 -
16
-
17
-
18
-
19
-
20
-
21
-
22
-
23
-
24
-
25
-
26
-
27
-
28
-
29
-
30
-
31
-
32
-
33
-
34
-
35
-
36
-
37
-
38
-
39
-
40
-
41
-
42
-
43
-
44
-
45
-
46
-
47
-
48
-
49
-
50
-
51
-
52
-
53
-
54
-
55
-
56
-
57
-
58
-
59
-
60
-
61
-
62
-
63
-
64
-
65
-
66
-
67
-
68
-
69
-
70
-
71
-
72
-
73
-
74
-
75
-
76
-
77
-
78
-
79
-
80
-
81
-
82
-
83
-
84
-
85
-
86
-
87
-
88
-
89
-
90
-
91
-
92
-
93
-
94
-
95
-
96
-
97
-
98
-
99
-
100
-
101
-
102
-
103
-
104
-
105
-
106
-
107
-
108
-
109
-
110
-
111
-
112
-
113
-
114
-
115
-
116
-
117
 |
 |

2
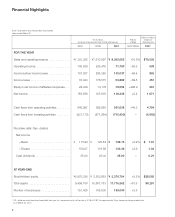
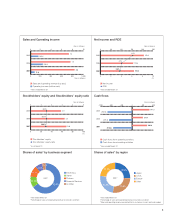
Dollars in millions*
Yen in millions Percent except per
except per share amounts and number of employees change share amounts
2005 2006 2007 2007/2006 2007
FOR THE YEAR
Sales and operating revenue . . . . . . . . . . . . . ¥7,191,325 ¥7,510,597 ¥ 8,295,695 +10.5.%$70,303
Operating income. . . . . . . . . . . . . . . . . . . . . . 145,628 226,416 71,750 –68.3.608
Income before income taxes . . . . . . . . . . . . . 157,207 286,329 102,037 –64.4.865
Income taxes . . . . . . . . . . . . . . . . . . . . . . . . . 16,044 176,515 53,888 –69.5.457
Equity in net income of affiliated companies . . . 29,039 13,176 78,654 +496.9.667
Net income . . . . . . . . . . . . . . . . . . . . . . . . . . 163,838 123,616 126,328 +2.2.1,071
Cash flows from operating activities . . . . . . . . 646,997 399,858 561,028 +40.3.4,754
Cash flows from investing activities . . . . . . . . (931,172) (871,264) (715,430) —(6,063)
Per share data: (Yen, dollars)
Net income
—Basic . . . . . . . . . . . . . . . . . . . . . . . . . . ¥ 175.90.¥ 122.58.¥ 126.15.+2.9.%$ 1.07.
—Diluted . . . . . . . . . . . . . . . . . . . . . . . . . 158.07.116.88.120.29.+2.9.1.02.
Cash dividends . . . . . . . . . . . . . . . . . . . . . . 25.00.25.00.25.00.—0.21.
AT YEAR-END
Stockholders’ equity . . . . . . . . . . . . . . . . . . . . ¥2,870,338 ¥ 3,203,852 ¥ 3,370,704 +5.2.%$28,565
Total assets . . . . . . . . . . . . . . . . . . . . . . . . . . 9,499,100 10,607,753 11,716,362 +10.5.99,291
Number of employees . . . . . . . . . . . . . . . . . . 151,400 158,500 163,000 +2.8.
* U.S. dollar amounts have been translated from yen, for convenience only, at the rate of ¥118=U.S.$1, the approximate Tokyo foreign exchange market rate
as of March 30, 2007.
Financial Highlights
Sony Corporation and Consolidated Subsidiaries
Years ended March 31