Sony 2007 Annual Report Download - page 111
Download and view the complete annual report
Please find page 111 of the 2007 Sony annual report below. You can navigate through the pages in the report by either clicking on the pages listed below, or by using the keyword search tool below to find specific information within the annual report.-
 1
1 -
2
-
3
-
4
-
5
-
6
-
7
-
8
-
9
-
10
-
11
-
12
-
13
-
14
-
15
-
16
-
17
-
18
-
19
-
20
-
21
-
22
-
23
-
24
-
25
-
26
-
27
-
28
-
29
-
30
-
31
-
32
-
33
-
34
-
35
-
36
-
37
-
38
-
39
-
40
-
41
-
42
-
43
-
44
-
45
-
46
-
47
-
48
-
49
-
50
-
51
-
52
-
53
-
54
-
55
-
56
-
57
-
58
-
59
-
60
-
61
-
62
-
63
-
64
-
65
-
66
-
67
-
68
-
69
-
70
-
71
-
72
-
73
-
74
-
75
-
76
-
77
-
78
-
79
-
80
-
81
-
82
-
83
-
84
-
85
-
86
-
87
-
88
-
89
-
90
-
91
-
92
-
93
-
94
-
95
-
96
-
97
-
98
-
99
-
100
-
 101
101 -
 102
102 -
 103
103 -
 104
104 -
 105
105 -
 106
106 -
 107
107 -
 108
108 -
 109
109 -
 110
110 -
 111
111 -
 112
112 -
 113
113 -
 114
114 -
 115
115 -
 116
116 -
 117
117
 |
 |

108
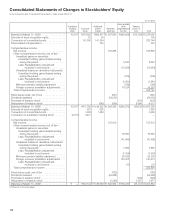
Yen in millions
Accumulated
Subsidiary Additional other Treasury
tracking Common paid-in Retained comprehensive stock, at
stock stock capital earnings income cost Total
Balance at March 31, 2004 . . . . . . . . . . . . . . . . .
¥3,917 ¥476,350 ¥992,817 ¥1,367,060 ¥(449,959) ¥(12,183) ¥2,378,002
Exercise of stock acquisition rights. . . . . . . . . . . .
52 53 105
Conversion of convertible bonds . . . . . . . . . . . . .
141,390 141,354 282,744
Stock-based compensation . . . . . . . . . . . . . . . . .
340 340
Comprehensive income:
Net income . . . . . . . . . . . . . . . . . . . . . . . . . . . .
163,838 163,838
Other comprehensive income, net of tax—
Unrealized gains on securities:
Unrealized holding gains (losses) arising
during the period . . . . . . . . . . . . . . . . . . .
5,643 5,643
Less: Reclassification adjustment
Less: included in net income . . . . . . . . . . .
(12,924) (12,924)
Unrealized losses on derivative instruments:
Unrealized holding gains (losses) arising
during the period . . . . . . . . . . . . . . . . . . .
(209) (209)
Less: Reclassification adjustment
Less: included in net income . . . . . . . . . . .
(1,681) (1,681)
Minimum pension liability adjustment . . . . . .
(769) (769)
Foreign currency translation adjustments . . .
74,224 74,224
Total comprehensive income . . . . . . . . . . . . . .
228,122
Stock issue costs, net of tax . . . . . . . . . . . . . . . .
(541) (541)
Dividends declared . . . . . . . . . . . . . . . . . . . . . . .
(24,030) (24,030)
Purchase of treasury stock. . . . . . . . . . . . . . . . . .
(416) (416)
Reissuance of treasury stock . . . . . . . . . . . . . . . .
(342) (245) 6,599 6,012
Balance at March 31, 2005 . . . . . . . . . . . . . . . . .
¥3,917 ¥617,792 ¥1,134,222 ¥1,506,082 ¥(385,675) ¥(6,000) ¥2,870,338
Exercise of stock acquisition rights. . . . . . . . . . . .
931 932 1,863
Conversion of convertible bonds . . . . . . . . . . . . .
1,484 1,484 2,968
Conversion of subsidiary tracking stock . . . . . . . .
(3,917) 3,917 —
Comprehensive income:
Net income . . . . . . . . . . . . . . . . . . . . . . . . . . . .
123,616 123,616
Other comprehensive income, net of tax—
Unrealized gains on securities:
Unrealized holding gains (losses) arising
during the period . . . . . . . . . . . . . . . . . . .
79,630 79,630
Less: Reclassification adjustment
Less: included in net income . . . . . . . . . . .
(41,495) (41,495)
Unrealized losses on derivative instruments:
Unrealized holding gains (losses) arising
during the period . . . . . . . . . . . . . . . . . . .
7,865 7,865
Less: Reclassification adjustment
Less: included in net income . . . . . . . . . . .
(7,424) (7,424)
Minimum pension liability adjustment . . . . . .
50,206 50,206
Foreign currency translation adjustments . . .
140,473 140,473
Less: Reclassification adjustment
Less: included in net incom
e. . . . . . . . . . . . (17) (17)
Total comprehensive income . . . . . . . . . . . . . .
352,854
Stock issue costs, net of tax . . . . . . . . . . . . . . . .
(780) (780)
Dividends declared . . . . . . . . . . . . . . . . . . . . . . .
(24,968) (24,968)
Purchase of treasury stock. . . . . . . . . . . . . . . . . .
(394) (394)
Reissuance of treasury stock . . . . . . . . . . . . . . . .
(1,296) 3,267 1,971
Balance at March 31, 2006 . . . . . . . . . . . . . . . . .
¥ — ¥624,124 ¥1,136,638 ¥1,602,654 ¥(156,437) ¥(3,127) ¥3,203,852
(Continued on following page)
Consolidated Statements of Changes in Stockholders’ Equity
Sony Corporation and Consolidated Subsidiaries—Years ended March 31