Sony 2007 Annual Report Download - page 5
Download and view the complete annual report
Please find page 5 of the 2007 Sony annual report below. You can navigate through the pages in the report by either clicking on the pages listed below, or by using the keyword search tool below to find specific information within the annual report.-
 1
1 -
 2
2 -
 3
3 -
 4
4 -
 5
5 -
 6
6 -
 7
7 -
 8
8 -
 9
9 -
 10
10 -
 11
11 -
 12
12 -
 13
13 -
 14
14 -
 15
15 -
 16
16 -
17
-
18
-
19
-
20
-
21
-
22
-
23
-
24
-
25
-
26
-
27
-
28
-
29
-
30
-
31
-
32
-
33
-
34
-
35
-
36
-
37
-
38
-
39
-
40
-
41
-
42
-
43
-
44
-
45
-
46
-
47
-
48
-
49
-
50
-
51
-
52
-
53
-
54
-
55
-
56
-
57
-
58
-
59
-
60
-
61
-
62
-
63
-
64
-
65
-
66
-
67
-
68
-
69
-
70
-
71
-
72
-
73
-
74
-
75
-
76
-
77
-
78
-
79
-
80
-
81
-
82
-
83
-
84
-
85
-
86
-
87
-
88
-
89
-
90
-
91
-
92
-
93
-
94
-
95
-
96
-
97
-
98
-
99
-
100
-
101
-
102
-
103
-
104
-
105
-
106
-
107
-
108
-
109
-
110
-
111
-
112
-
113
-
114
-
115
-
116
-
117
 |
 |

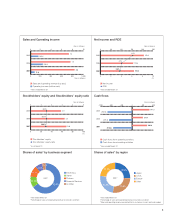
3
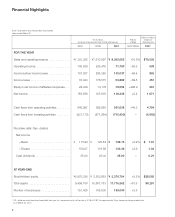
11.7%
65.4%
11.7%
7.5%3.7%
26.9%
25.6%
24.6%
22.9%
2000 400 600 800 1,000
40
7.2
145.6
226.4
8.3
71.8
6810
2005
2006
2007
2
7.5
(Yen in trillions)
(Yen in billions)
30.2%
28.8%
30.2%
200406080100
20
2.9
3.2
3.4
34 5
2005
2006
2007
1
(Yen in trillions)
(%)
Sales and operating revenue (top axis)
Operating income (bottom axis)
Stockholders’ equity
Stockholders’ equity ratio
2007
4.1%
3.8%
6.2%
2046810
800
163.8
123.6
126.3
120 160 200
2005
2006
2007
40
(Yen in billions)
(%)
-400-1,200
647.0
(931.2)
399.9
(871.3)
561.0
(715.4)
0 400 800
2005
2006
2007
-800
(Yen in billions)
Net income
ROE
Cash flows from operating activities
Cash flows from investing activities
2007
Electronics
Game
Pictures
Financial Services
All Other
Japan
U.S.A.
Europe
Other
Shares of sales* by business segment Shares of sales* by region
Stockholders’ equity and Stockholders’ equity ratio Cash flows
Sales and Operating income Net income and ROE
*Years ended March 31 *Years ended March 31
*As of March 31 *Years ended March 31
*Year ended March 31
*Percentage of sales and operating revenue to outside customers
*Year ended March 31
*Percentage of sales and operating revenue to outside customers
*Sales and operating revenue accounted for by customers in each particular region