Sony 2007 Annual Report Download - page 67
Download and view the complete annual report
Please find page 67 of the 2007 Sony annual report below. You can navigate through the pages in the report by either clicking on the pages listed below, or by using the keyword search tool below to find specific information within the annual report.-
 1
1 -
2
-
3
-
4
-
5
-
6
-
7
-
8
-
9
-
10
-
11
-
12
-
13
-
14
-
15
-
16
-
17
-
18
-
19
-
20
-
21
-
22
-
23
-
24
-
25
-
26
-
27
-
28
-
29
-
30
-
31
-
32
-
33
-
34
-
35
-
36
-
37
-
38
-
39
-
40
-
41
-
42
-
43
-
44
-
45
-
46
-
47
-
48
-
49
-
50
-
51
-
52
-
53
-
54
-
55
-
56
-
 57
57 -
 58
58 -
 59
59 -
 60
60 -
 61
61 -
 62
62 -
 63
63 -
 64
64 -
 65
65 -
 66
66 -
 67
67 -
 68
68 -
 69
69 -
 70
70 -
 71
71 -
 72
72 -
 73
73 -
 74
74 -
 75
75 -
 76
76 -
 77
77 -
78
-
79
-
80
-
81
-
82
-
83
-
84
-
85
-
86
-
87
-
88
-
89
-
90
-
91
-
92
-
93
-
94
-
95
-
96
-
97
-
98
-
99
-
100
-
101
-
102
-
103
-
104
-
105
-
106
-
107
-
108
-
109
-
110
-
111
-
112
-
113
-
114
-
115
-
116
-
117
 |
 |

64
OPERATING PERFORMANCE BY BUSINESS SEGMENT
The following discussion is based on segment information.
Sales and operating revenue in each business segment include
intersegment transactions. Refer to Note 24 of Notes to
Consolidated Financial Statements.
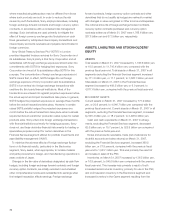
BUSINESS SEGMENT INFORMATION
Yen in billions Percent change
Years ended March 31 2006 2007 2007/2006
Sales and operating revenue
Electronics . . . . . . . . . . . .
5,176.4 6,050.5 +16.9%
Game . . . . . . . . . . . . . . . .
958.6 1,016.8 +6.1%
Pictures . . . . . . . . . . . . . .
745.9 966.3 +29.5%
Financial Services . . . . . . .
743.2 649.3 –12.6%
All Other . . . . . . . . . . . . . .
426.0 377.6 –11.4%
Elimination . . . . . . . . . . . .
(539.5) (764.8) —%
Consolidated . . . . . . . . . . . .
7,510.6 8,295.7 +10.5%
Operating income (loss)
Electronics . . . . . . . . . . . .
6.9 156.7 +2,167.4%
Game . . . . . . . . . . . . . . . .
8.7 (232.3) —%
Pictures . . . . . . . . . . . . . .
27.4 42.7 +55.7%
Financial Services . . . . . . .
188.3 84.1 –55.3%
All Other . . . . . . . . . . . . . .
20.5 32.4 +57.9%
Sub-Total . . . . . . . . . . . . . . .
251.9 83.7 –66.8%
Elimination and unallocated
corporate expenses . . . .
(25.5) (11.9) —%
Consolidated . . . . . . . . . . . .
226.4 71.8 –68.3%
■ELECTRONICS
Sales and operating revenue for the fiscal year ended March 31,
2007 increased 874.1 billion yen, or 16.9 percent, to 6,050.5
billion yen compared with the previous fiscal year. Operating
income increased by 149.8 billion yen, or 2,167.4 percent, to
156.7 billion yen compared with the previous fiscal year and the
operating income to sales ratio increased from 0.1 percent to 2.6
percent. Sales to outside customers on a yen basis increased
13.5 percent compared to the previous fiscal year. Regarding
sales to outside customers by geographical area, sales increased
by 7 percent in Japan, by 9 percent in the U.S., by 24 percent in
Europe, and by 14 percent in non-Japan Asia and other
geographic areas (“Other Areas”).
In Japan, there was a significant increase in the sales of
mobile phones, principally to Sony Ericsson, and LCD televisions,
while sales decreased for DVD recorders, personal computers
(“PCs”) and CRT televisions. In the U.S., sales of LCD televisions
significantly increased, while sales decreased for LCD rear-
projection and CRT televisions. In Europe, sales increased for
LCD televisions and PCs, while sales declined for CRT televi-
sions and home-use video cameras. In Other Areas, sales of
LCD televisions and digital cameras increased, while sales of
mobile phones, primarily to Sony Ericsson, and CRT televisions
decreased. The decrease in sales of mobile phones was due to
the impact of the deconsolidation resulting from the transfer to
Sony Ericsson in the previous fiscal year of the stock of a
Chinese subsidiary that mainly assembled mobile phones.
● Performance by Product Category
Sales and operating revenue by product category discussed
below represent sales to outside customers, which do not
include intersegment transactions. Refer to Note 24 of Notes to
Consolidated Financial Statements.
“Audio” sales decreased by 13.3 billion yen, or 2.5 percent, to
522.9 billion yen. Sales of flash memory and hard drive digital
audio players decreased due to a change in model mix, as unit
shipments of approximately 4.5 million units were flat compared
to the previous fiscal year. On the other hand, there was a
significant decrease in sales of both CD and MiniDisc (“MD”)
format headphone stereos due to a shift in market demand.
However, car audio and home audio sales increased.
“Video” sales increased by 121.8 billion yen, or 11.9 percent,
to 1,143.1 billion yen. Sales of digital cameras increased in Japan,
the U.S. and Europe. Worldwide shipments of digital cameras
increased by approximately 3.5 million units to approximately
■ Electronics
■ Game
■ Pictures
■ Financial Services
■ All Other
*Year ended March 31, 2007
*Including intersegment transactions
Shares of sales and operating revenue by business segment
11.2%
66.8%
10.6%
7.2%4.2%
(Yen in trillions) (Yen in billions)
Sales and operating income
in the Electronics segment
■ Sales (left)
■ Operating income (right)
● Operating margin
*Years ended March 31
8
6
4
2
0
400
300
200
100
0
2005 2006 2007
0.1%
2.6%
0.1%