Sony 2007 Annual Report Download - page 81
Download and view the complete annual report
Please find page 81 of the 2007 Sony annual report below. You can navigate through the pages in the report by either clicking on the pages listed below, or by using the keyword search tool below to find specific information within the annual report.-
 1
1 -
2
-
3
-
4
-
5
-
6
-
7
-
8
-
9
-
10
-
11
-
12
-
13
-
14
-
15
-
16
-
17
-
18
-
19
-
20
-
21
-
22
-
23
-
24
-
25
-
26
-
27
-
28
-
29
-
30
-
31
-
32
-
33
-
34
-
35
-
36
-
37
-
38
-
39
-
40
-
41
-
42
-
43
-
44
-
45
-
46
-
47
-
48
-
49
-
50
-
51
-
52
-
53
-
54
-
55
-
56
-
57
-
58
-
59
-
60
-
61
-
62
-
63
-
64
-
65
-
66
-
67
-
68
-
69
-
70
-
 71
71 -
 72
72 -
 73
73 -
 74
74 -
 75
75 -
 76
76 -
 77
77 -
 78
78 -
 79
79 -
 80
80 -
 81
81 -
 82
82 -
 83
83 -
 84
84 -
 85
85 -
 86
86 -
 87
87 -
 88
88 -
 89
89 -
 90
90 -
 91
91 -
92
-
93
-
94
-
95
-
96
-
97
-
98
-
99
-
100
-
101
-
102
-
103
-
104
-
105
-
106
-
107
-
108
-
109
-
110
-
111
-
112
-
113
-
114
-
115
-
116
-
117
 |
 |

78
trade, and an increase in future insurance policy benefits and
other as well as the contribution of net income after taking into
account depreciation and amortization. However, primarily
offsetting these contributions was an increase in notes and
accounts receivable, trade, and inventory, particularly within
the Electronics and Game segments.
Compared with the previous fiscal year, net cash provided by
operating activities increased mainly as a result of an increase in
net income after taking into account depreciation and amortiza-
tion recorded during the fiscal year as compared to the previous
fiscal year, as well as the effect of the gain on the transfer to
the Japanese government of the substitutional portion of the
employee pension fund in the previous fiscal year, and the effect
of an increase in revenue from insurance premiums, primarily
reflecting an increase in insurance-in-force at Sony Life.
Investing Activities: During the fiscal year, Sony used 715.4
billion yen of net cash in investing activities, a decrease of 155.8
billion yen, or 17.9 percent, compared with the previous fiscal
year. Of this total, all segments, excluding the Financial Services
segment, used 431.1 billion yen of net cash in investing activities,
an increase of 134.7 billion yen, or 45.5 percent, compared with
the previous fiscal year, and the Financial Services segment
used 276.7 billion yen in net cash, a decrease of 287.0 billion
yen, or 50.9 percent, compared with the previous fiscal year.
During the fiscal year, purchases of fixed assets (capital
expenditures) in the Electronics segment were made primarily
for semiconductor manufacturing facilities. Part of an investment
in S-LCD was also made for manufacturing facilities for 8th
generation TFT LCD panels.
Within the Financial Services segment, payments for invest-
ments and advances, such as investments mainly in Japanese
fixed income securities at Sony Life and an increase in the
outstanding balance of mortgage loans at Sony Bank, exceeded
proceeds from the maturities of marketable securities, sales of
securities investments and collections of advances.
Compared with the previous fiscal year, net cash used in
investing activities increased within all segments excluding the
Financial Services segment, reflecting the additional investment in
S-LCD and the purchases of fixed assets noted above. On the
other hand, net cash used in the Financial Services segment for
investing activities decreased compared to the previous fiscal year
due to the fact that there was an increase in the collections of
investments and advances as compared to the previous fiscal year.
In all segments excluding the Financial Services segment,
the difference between cash generated from operating activities
and cash used in investing activities was a net use of cash
of 125.5 billion yen, an increase of 81.1 billion yen, or 182.7
percent, as compared to a net use of cash of 44.4 billion yen
in the previous fiscal year.
Financing Activities: During the fiscal year ended March 31,
2007, 247.9 billion yen of net cash was provided by financing
activities. Of the total, 59.6 billion yen of net cash was generated
from financing activities in all segments excluding the Financial
Services segment, a decrease of 15.0 billion yen or 20.1 percent,
compared to net cash generated in the previous fiscal year of
74.6 billion yen. This was a result, as noted above, of financing
carried out through yen-denominated syndicated loans during
the current fiscal year.
In the Financial Services segment, as a result of an increase in
policyholder accounts at Sony Life and an increase in deposits
from customers at the banking business, financing activities
generated 179.6 billion yen of net cash.
Accounting for all these factors and the effect of exchange
rate changes, the total outstanding balance of cash and cash
equivalents at the end of the fiscal year increased by 96.8 billion
yen, or 13.8 percent, to 799.9 billion yen, compared with the
end of the previous fiscal year. The total outstanding balance
of cash and cash equivalents of all segments, excluding the
Financial Services segment, decreased by 62.6 billion yen, or
10.7 percent, to 522.9 billion yen, and for the Financial Services
segment, increased by 159.4 billion, or 135.5 percent, to 277.0
billion yen, compared with the end of the previous fiscal year.
CONDENSED STATEMENTS OF CASH FLOWS
SEPARATING OUT THE FINANCIAL SERVICES SEGMENT
(UNAUDITED)
The following schedule shows unaudited condensed statements
of cash flow for the Financial Services segment and all other
segments excluding the Financial Services segment as well as
condensed consolidated statements of cash flow. These
presentations are not required under U.S. GAAP, which is used
in Sony’s consolidated financial statements. However, because
the Financial Services segment is different in nature from Sony’s
other segments, Sony believes that a comparative presentation
may be useful in understanding and analyzing Sony’s
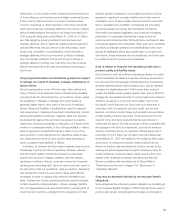
(Yen in billions)
Cash flows
■ Cash flows from operating activities
■ Cash flows from investing activities
■ Cash flows from financing activities
*Years ended March 31
1,000
500
0
–500
–1,000 2005 2006 2007