Sony 2007 Annual Report Download - page 71
Download and view the complete annual report
Please find page 71 of the 2007 Sony annual report below. You can navigate through the pages in the report by either clicking on the pages listed below, or by using the keyword search tool below to find specific information within the annual report.-
 1
1 -
2
-
3
-
4
-
5
-
6
-
7
-
8
-
9
-
10
-
11
-
12
-
13
-
14
-
15
-
16
-
17
-
18
-
19
-
20
-
21
-
22
-
23
-
24
-
25
-
26
-
27
-
28
-
29
-
30
-
31
-
32
-
33
-
34
-
35
-
36
-
37
-
38
-
39
-
40
-
41
-
42
-
43
-
44
-
45
-
46
-
47
-
48
-
49
-
50
-
51
-
52
-
53
-
54
-
55
-
56
-
57
-
58
-
59
-
60
-
 61
61 -
 62
62 -
 63
63 -
 64
64 -
 65
65 -
 66
66 -
 67
67 -
 68
68 -
 69
69 -
 70
70 -
 71
71 -
 72
72 -
 73
73 -
 74
74 -
 75
75 -
 76
76 -
 77
77 -
 78
78 -
 79
79 -
 80
80 -
 81
81 -
82
-
83
-
84
-
85
-
86
-
87
-
88
-
89
-
90
-
91
-
92
-
93
-
94
-
95
-
96
-
97
-
98
-
99
-
100
-
101
-
102
-
103
-
104
-
105
-
106
-
107
-
108
-
109
-
110
-
111
-
112
-
113
-
114
-
115
-
116
-
117
 |
 |
68
CONDENSED STATEMENTS OF INCOME
Yen in millions
Sony without
Financial Services Financial Services Consolidated
Years ended March 31 2006 2007 2006 2007 2006 2007
Financial Services revenue . . . . . . . . . . . . . . . . . . . . . . . . . . . . . .
743,215 649,341 ——720,566 624,282
Net sales and operating revenue . . . . . . . . . . . . . . . . . . . . . . . . .
——6,799,068 7,680,578 6,790,031 7,671,413
. . . . . . . . . . . . . . . . . . . . . . . . . . . . . . . . . . . . . . . . . . . . . . . . . .
743,215 649,341 6,799,068 7,680,578 7,510,597 8,295,695
Costs and expenses . . . . . . . . . . . . . . . . . . . . . . . . . . . . . . . . . .
554,892 565,199 6,762,194 7,694,375 7,284,181 8,223,945
Operating income (loss) . . . . . . . . . . . . . . . . . . . . . . . . . . . . . . . .
188,323 84,142 36,874 (13,797) 226,416 71,750
Other income (expenses), net . . . . . . . . . . . . . . . . . . . . . . . . . . .
24,522 9,886 36,610 27,917 59,913 30,287
Income before income taxes . . . . . . . . . . . . . . . . . . . . . . . . . . . .
212,845 94,028 73,484 14,120 286,329 102,037
Income taxes and other . . . . . . . . . . . . . . . . . . . . . . . . . . . . . . . .
78,527 33,536 84,186 (57,991) 162,713 (24,291)
Net income (loss) . . . . . . . . . . . . . . . . . . . . . . . . . . . . . . . . . . . . .
134,318 60,492 (10,702) 72,111 123,616 126,328
decreased and the operating loss increased primarily due to
decreases in revenue and profit at leasing and installment
businesses. However, revenue increased at the credit card
business which resulted in a decrease in the operating loss
recorded for that business.
reason for this decrease was lower valuation gains in the general
and separate accounts as compared to the previous fiscal year,
when there was a significant increase in the Japanese stock
market. Operating income at Sony Life decreased by 106.8
billion yen or 56.7 percent to 81.7 billion yen, primarily due to
a decrease in valuation gains from investments in the general
account, including valuation gains from convertible bonds.
At Sony Assurance, revenue increased due to higher insurance
revenue brought about by an expansion in automobile insurance-
in-force. Operating income increased due to an increase in
insurance revenue and an improvement in the expense ratio
(the ratio of sales, general and administrative expenses and
commissions to net premiums written).
At Sony Bank, revenue rose mainly due to a significant
decrease of foreign exchange losses from part of Sony Bank’s
foreign currency deposits, as compared with the previous fiscal
year, and an increase in interest revenue associated with an
increase in the balance of assets from investing activities. As a
result, Sony Bank recorded operating income in the fiscal year
ended March 31, 2007, as compared to an operating loss in
the previous fiscal year.
At Sony Finance International, Inc., a leasing and credit
financing business subsidiary in Japan, overall revenue
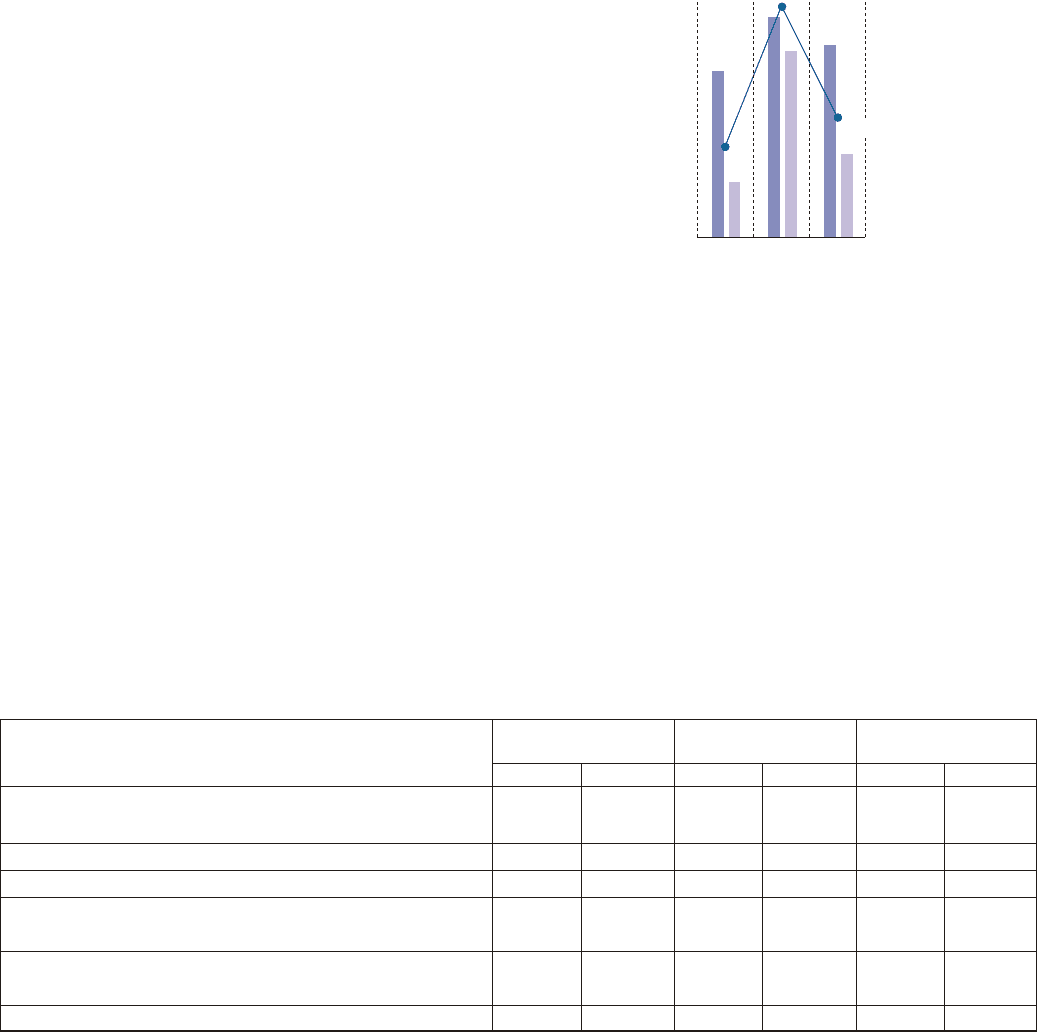
(Billions of yen) (Billions of yen)
Revenue and operating income in
the Financial Services segment
■ Financial Services revenue (left)
■ Operating income (right)
● Operating margin
*Years ended March 31
800
600
400
200
0
240
180
120
60
0
2005 2006 2007
9.9%
25.3%
13.0%
●Condensed Statements of Income Separating Out the
Financial Services Segment (Unaudited)
The following schedule shows unaudited condensed statements
of income for the Financial Services segment and all other seg-
ments excluding Financial Services as well as condensed con-
solidated statements of income. This presentation is not required
under U.S. GAAP, which is used in Sony’s consolidated financial
statements. However, because the Financial Services segment
is different in nature from Sony’s other segments, Sony believes
that a comparative presentation may be useful in understanding
and analyzing Sony’s consolidated financial statements.
Transactions between the Financial Services segment and all
other segments excluding Financial Services are eliminated in
the consolidated figures shown below.