Sony 2012 Annual Report Download - page 32
Download and view the complete annual report
Please find page 32 of the 2012 Sony annual report below. You can navigate through the pages in the report by either clicking on the pages listed below, or by using the keyword search tool below to find specific information within the annual report.-
 1
1 -
2
-
3
-
4
-
5
-
6
-
7
-
8
-
9
-
10
-
11
-
12
-
13
-
14
-
15
-
16
-
17
-
18
-
19
-
20
-
21
-
 22
22 -
 23
23 -
 24
24 -
 25
25 -
 26
26 -
 27
27 -
 28
28 -
 29
29 -
 30
30 -
 31
31 -
 32
32 -
 33
33 -
 34
34 -
 35
35 -
 36
36 -
 37
37 -
 38
38 -
 39
39 -
 40
40 -
 41
41 -
 42
42 -
43
-
44
-
45
-
46
-
47
-
48
-
49
-
50
-
51
-
52
-
53
-
54
-
55
-
56
-
57
-
58
-
59
-
60
-
61
-
62
-
63
-
64
-
65
-
66
-
67
-
68
-
69
-
70
-
71
-
72
 |
 |

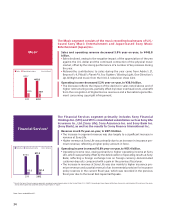
●Consolidated sales decreased year-on-year primarily due to the unfavorable impact of foreign exchange
rates, the impact of the Great East Japan Earthquake and the floods in Thailand, and deterioration in
market conditions in developed countries.
●Consolidated operating loss was recorded compared to income in the previous fiscal year primarily due
to the above-mentioned lower sales factors and a significant deterioration in equity in net income (loss)
of aliated companies.
●A large net loss attributable to Sony Corporation’s stockholders was recorded mainly due to the
recording of a non-cash tax expense related to the establishment of valuation allowances against
deferred tax assets, predominantly in the U.S.
Sales and operating revenue ¥6,493.2 billion (–9.6%)
Operating income (loss) (¥67.3 billion) ( — )
Income (loss) before income taxes (¥83.2 billion) ( — )
(¥456.7 billion) ( — )
Note: Percentage change from the previous fiscal year is shown in parentheses.
Consolidated Financial Results for the
Fiscal Year Ended March 31, 2012 (Fiscal Year 2011)
Net income (loss) attributable to
Sony Corporation’s stockholders
Sales and operating revenue
(Yen in trillions)
7.2 7.2
6.5
2010 2011 2012
Net loss attributable to
Sony Corporation’s stockholders
(Yen in billions)
(456.7)
(259.6)
(40.8)
2010 2011 2012
Operating income (loss)
(Yen in billions)
199.8
252.8
31.8
213.4
(67.3)
138.5
2010 2011 2012
Net loss attributable to Sony Corporation’s
stockholders
Operating income (loss)
Operating income (loss), as adjusted,
which excludes equity in net income (loss)
of aliated companies and restructuring
charges and impairments of long-lived assets
Note: Years ended March 31
Note: This is not a presentation in accordance with
Generally Accepted Accounting Principles in
the U.S.
Business Highlights—— Consolidated Results
30