Sony 2012 Annual Report Download - page 34
Download and view the complete annual report
Please find page 34 of the 2012 Sony annual report below. You can navigate through the pages in the report by either clicking on the pages listed below, or by using the keyword search tool below to find specific information within the annual report.-
 1
1 -
2
-
3
-
4
-
5
-
6
-
7
-
8
-
9
-
10
-
11
-
12
-
13
-
14
-
15
-
16
-
17
-
18
-
19
-
20
-
21
-
22
-
23
-
 24
24 -
 25
25 -
 26
26 -
 27
27 -
 28
28 -
 29
29 -
 30
30 -
 31
31 -
 32
32 -
 33
33 -
 34
34 -
 35
35 -
 36
36 -
 37
37 -
 38
38 -
 39
39 -
 40
40 -
 41
41 -
 42
42 -
 43
43 -
 44
44 -
45
-
46
-
47
-
48
-
49
-
50
-
51
-
52
-
53
-
54
-
55
-
56
-
57
-
58
-
59
-
60
-
61
-
62
-
63
-
64
-
65
-
66
-
67
-
68
-
69
-
70
-
71
-
72
 |
 |
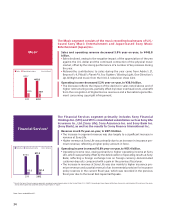
(Yen in billions)
3,849.8
10.8
3,136.8
(229.8)
2011 2012
Sales Operating income (loss)
Consumer
Products &
Services
The Consumer Products & Services segment includes televisions, home
audio and video, digital imaging, personal and mobile products and
the game business.
Sales and operating revenue decreased 18.5% year-on-year, to ¥3,136.8
billion.
Sales to outside customers decreased 18.8% year-on-year.
LCD television sales declined, reflecting lower unit sales and price declines,
largely as a result of market contractions in Japan and the deterioration of
market conditions in Europe and North America. Sales of PCs and digital
imaging products, including digital cameras, were also down, mainly reflect-
ing the impact of the floods in Thailand and unfavorable foreign exchange
rates. Lower sales of PlayStation®3 hardware, due to a strategic price reduc-
tion, and of PlayStation®2, due to platform migration, led to a decrease in
sales in the game business.
An operating loss of ¥229.8 billion was recorded, compared with operat-
ing income of ¥10.8 billion in the previous fiscal year.
The segment’s operating loss was due primarily to such factors as a decrease
in gross profit, provoked by the segment sales decline noted above (exclud-
ing the impact of foreign exchange rates), and the deterioration of both the
cost of sales ratio and equity in net income (loss) of aliated companies.
Product categories contributing to the decline in operating income—exclud-
ing restructuring charges, an impairment loss on Sony’s shares in S-LCDs
and subsequent foreign currency adjustments and impairments of long-lived
assets—were LCD televisions, a result of additional LCD panel-related
expenses arising from low capacity utilization for S-LCDs and of a decline in
sales, and the game business, also reflecting a decline in sales.
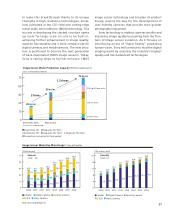
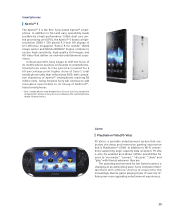
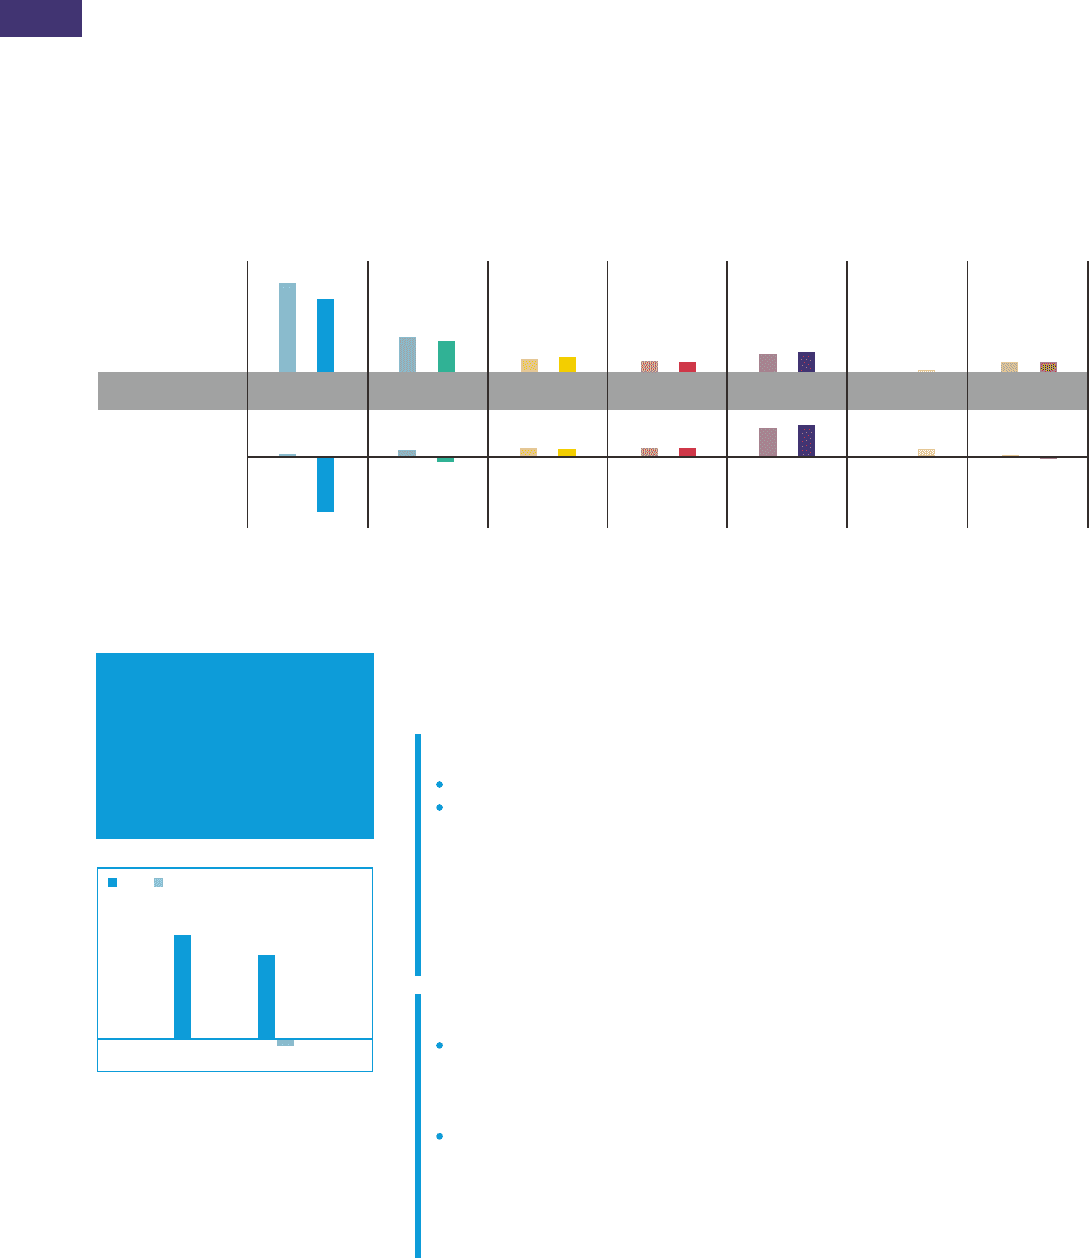
38.9 36.9
Sales and Operating Income by Segment
(Yen in billions)
Left: 2011
Right: 2012
Sales
Left: 2011
Right: 2012
Operating
Income (Loss)
3,849.8
3,136.8
10.8
(229.8)
27.7
(20.2)
38.7 34.1
118.8 131.4
4.2 31.4
77.7
7.1
(3.5)
1,503.3 1,313.8
600.0 657.7 470.7 442.8 447.8 442.7
806.5 871.9
Consumer
Products & Services
Professional,
Device & Solutions
Sony Mobile
Communications All Other
Pictures Music Financial Services
* Includes operating revenue and intersegment sales; for Financial Services, denotes revenue.
** Includes intersegment profits.
*
Business Highlights—— Results by Business Segment
Notes: 1. Years ended March 31.
2. Sony realigned its reportable segments from the first quarter of the fiscal year ended March 31, 2012 to reflect modifications to the organizational structure as of April 1, 2011. In connection
with this realignment, both the sales and operating revenue (“sales”) and operating income (loss) of each segment in the fiscal year ended March 31, 2011 have been revised to conform to
the current presentation. On February 15, 2012, Sony Ericsson changed its name to Sony Mobile Communications AB (“Sony Mobile”) upon becoming a wholly owned subsidiary of Sony.
Accordingly, the Sony Ericsson segment that had been presented as a separate segment was renamed as the Sony Mobile segment during the fourth quarter ended March 31, 2012.
32
**