Sony 2012 Annual Report Download - page 36
Download and view the complete annual report
Please find page 36 of the 2012 Sony annual report below. You can navigate through the pages in the report by either clicking on the pages listed below, or by using the keyword search tool below to find specific information within the annual report.-
 1
1 -
2
-
3
-
4
-
5
-
6
-
7
-
8
-
9
-
10
-
11
-
12
-
13
-
14
-
15
-
16
-
17
-
18
-
19
-
20
-
21
-
22
-
23
-
24
-
25
-
 26
26 -
 27
27 -
 28
28 -
 29
29 -
 30
30 -
 31
31 -
 32
32 -
 33
33 -
 34
34 -
 35
35 -
 36
36 -
 37
37 -
 38
38 -
 39
39 -
 40
40 -
 41
41 -
 42
42 -
 43
43 -
 44
44 -
 45
45 -
 46
46 -
47
-
48
-
49
-
50
-
51
-
52
-
53
-
54
-
55
-
56
-
57
-
58
-
59
-
60
-
61
-
62
-
63
-
64
-
65
-
66
-
67
-
68
-
69
-
70
-
71
-
72
 |
 |

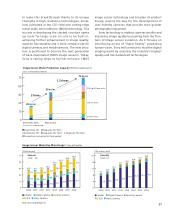
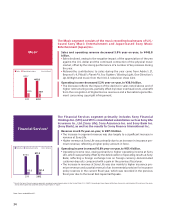
Music
Financial Services*
(Yen in billions)
470.7
442.8
38.9 36.9
2011 2012
Sales Operating income
The Music segment consists of the music recording businesses of U.S.-
based Sony Music Entertainment and Japan-based Sony Music
Entertainment (Japan) Inc.
(Yen in billions)
2011 2012
871.9
806.5
118.8 131.4
Revenue Operating income
The Financial Services segment primarily includes Sony Financial
Holdings Inc. (SFH) and SFH’s consolidated subsidiaries such as Sony Life
Insurance Co., Ltd. (Sony Life), Sony Assurance Inc. and Sony Bank Inc.
(Sony Bank), as well as the results for Sony Finance International Inc.
Sales and operating revenue decreased 5.9% year-on-year, to ¥442.8
billion.
Sales declined, owing to the negative impact of the appreciation of the yen
against the U.S. dollar and the continued contraction of the physical music
market, oset by the strong performance of a number of key releases during
the year.
Noteworthy contributions to sales during the year came from Adele’s 21,
Beyoncè’s 4, Pitbull’s Planet Pit, Foo Fighters’ Wasting Light, One Direction’s
Up All Night and music from the hit U.S. television show Glee.
Operating income decreased 5.2% year-on-year, to ¥36.9 billion.
The decrease reflects the impact of the decline in sales noted above and of
higher restructuring costs, partially oset by lower overhead costs, a benefit
from the recognition of digital license revenues and a favorable legal settle-
ment concerning copyright infringement.
Revenue rose 8.1% year-on-year, to ¥871.9 billion.
The increase in segment revenue was due largely to a significant increase in
revenue at Sony Life.
Higher revenue at Sony Life was primarily due to an increase in insurance pre-
mium revenue, reflecting a higher policy amount in force.
Operating income increased 10.6% year-on-year, to ¥131.4 billion.
Operating income rose, owing primarily to higher operating income at Sony
Life, which was partially oset by the deterioration of operating results at Sony
Bank, reflecting a foreign exchange loss on foreign currency-denominated
customer deposits compared with a gain in the previous fiscal year.
The increase in revenue at Sony Life was due mainly to higher insurance pre-
mium revenue and a partial reversal of an incremental provision for insurance
policy reserves in the current fiscal year, which was recorded in the previous
fiscal year due to the Great East Japan Earthquake.
* Results for Sony Life are based on generally accepted accounting principles in the United States (U.S. GAAP). Accordingly, these figures dier from the results published by SFH and Sony Life, which
are based on generally accepted accounting principles in Japan.
Note: Years ended March 31.
34