Sony 2012 Annual Report Download - page 35
Download and view the complete annual report
Please find page 35 of the 2012 Sony annual report below. You can navigate through the pages in the report by either clicking on the pages listed below, or by using the keyword search tool below to find specific information within the annual report.-
 1
1 -
2
-
3
-
4
-
5
-
6
-
7
-
8
-
9
-
10
-
11
-
12
-
13
-
14
-
15
-
16
-
17
-
18
-
19
-
20
-
21
-
22
-
23
-
24
-
 25
25 -
 26
26 -
 27
27 -
 28
28 -
 29
29 -
 30
30 -
 31
31 -
 32
32 -
 33
33 -
 34
34 -
 35
35 -
 36
36 -
 37
37 -
 38
38 -
 39
39 -
 40
40 -
 41
41 -
 42
42 -
 43
43 -
 44
44 -
 45
45 -
46
-
47
-
48
-
49
-
50
-
51
-
52
-
53
-
54
-
55
-
56
-
57
-
58
-
59
-
60
-
61
-
62
-
63
-
64
-
65
-
66
-
67
-
68
-
69
-
70
-
71
-
72
 |
 |

Pictures
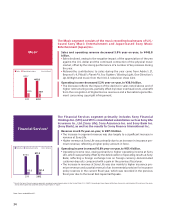
Professional,
Device & Solutions
(Yen in billions)
1,503.3 1,313.8
27.7
(20.2)
2011 2012
Sales Operating income (loss)
The Professional, Device & Solutions segment includes professional
solutions, semiconductors and components.
(Yen in billions)
600.0 657.7
38.7 3 4 .1
2011 2012
Sales Operating income
The Pictures segment consists of motion pictures and television produc-
tion and distribution, and other businesses of Sony Pictures
Entertainment Inc. (SPE), which is based in the United States.
Sales and operating revenue decreased 12.6% year-on-year, to ¥1,313.8
billion.
Sales to outside customers decreased 9.3% year-on-year.
In the components category, batteries and storage media sales were primar-
ily aected by the impact of the Great East Japan Earthquake and unfavorable
foreign exchange rates.
The segment reported an operating loss of ¥20.2 billion, compared with
operating income of ¥27.7 billion in the previous fiscal year.
The operating loss was attributable to the deterioration of the cost of sales
ratio, as well as to unfavorable foreign exchange rates and a decrease in
gross profit due to lower sales (excluding the impact of foreign exchange
rates).
One product category that had a particularly unfavorable impact on the
change in segment operating results (excluding restructuring charges) was
components.
Sales increased 9.6% year-on-year, to ¥657.7 billion.
Sales rose (an 18% year-on-year increase on a U.S.-dollar basis) benefiting
from higher television revenues from the licensing of U.S. programming,
revenues recognized from the consolidation of Game Show Network, LLC
(GSN)—which was accounted for under the equity method in the previous
fiscal year—and higher advertising revenues from SPE’s television networks
in India.
Operating income decreased 11.7% year-on-year, to ¥34.1 billion.
Operating income decreased, owing to a gain recognized in the previous
fiscal year, consisting of a remeasurement gain on the acquisition of a con-
trolling interest in GSN and a gain on the sale of SPE’s remaining equity
interest in a Latin American premium pay television business.
33