Sysco 2007 Annual Report Download - page 13
Download and view the complete annual report
Please find page 13 of the 2007 Sysco annual report below. You can navigate through the pages in the report by either clicking on the pages listed below, or by using the keyword search tool below to find specific information within the annual report.-
 1
1 -
2
-
 3
3 -
 4
4 -
 5
5 -
 6
6 -
 7
7 -
 8
8 -
 9
9 -
 10
10 -
 11
11 -
 12
12 -
 13
13 -
 14
14 -
 15
15 -
 16
16 -
 17
17 -
 18
18 -
 19
19 -
 20
20 -
 21
21 -
 22
22 -
 23
23 -
24
-
25
-
26
-
27
-
28
-
29
-
30
-
31
-
32
-
33
-
34
-
35
-
36
-
37
-
38
-
39
-
40
-
41
-
42
-
43
-
44
-
45
-
46
-
47
-
48
-
49
-
50
-
51
-
52
-
53
-
54
-
55
-
56
-
57
-
58
-
59
-
60
-
61
-
62
-
63
-
64
-
65
-
66
-
67
-
68
-
69
-
70
-
71
-
72
-
73
-
74
-
75
-
76
-
77
-
78
-
79
-
80
-
81
-
82
-
83
-
84
-
85
-
86
-
87
-
88
-
89
-
90
-
91
-
92
-
93
-
94
-
95
-
96
-
97
-
98
-
99
-
100
-
101
-
102
-
103
-
104
-
105
-
106
-
107
-
108
 |
 |

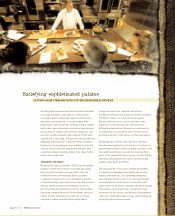
As operating companies place orders through DPR,
the system evaluates economic variables that affect
replenishment activities and synchronizes the
forecasting, planning and ordering functions with
the RDC, decreasing product lead times. The DPR
system coordinates with the Supply Chain Inventory
Management Department at the corporate office
to analyze and aggregate forecasts. The DPR system
also creates seasonal profiles that identify year-over-
year sales trends, chooses the most economic ordering
frequency and optimizes purchasing through forward
buys. Throughout the entire process, the system
is tracking inventory levels related to the products
ordered. Initially, the DPR system was to be installed
as operating companies were preparing to be served
by the RDC, but it has proven so effective it has been
implemented throughout our U.S. broadline companies.
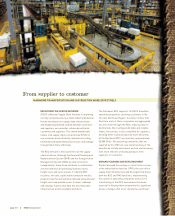
TRANSPORTATION MANAGEMENT SYSTEM
The Transportation Management System has now
been installed at all SYSCO U.S. broadline operating
companies. This system gives us the ability to
consolidate all inbound load planning and execution.
This allows us to design better truckloads and
significantly leverage our freight buying power.
Our model includes the use of contract carriers,
which allows us to develop closer relationships with
fewer carriers, and should result in lower rates
and greater availability to transportation capacity
during peak periods. By managing the freight
lanes, we are better able to control our costs while
maintaining complete visibility of shipments as they
move along the supply routes.
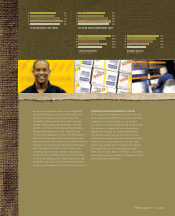
20%
19%
23%
25%
23%
07
06
05
04
03
RETURN ON AVERAGE TOTAL CAPITAL
31%
30%
35%
39%
36%
07
06
05
04
03
RETURN ON AVERAGE SHAREHOLDERS’ EQUITY
603.2
513.9
390.0
530.1
435.6
07
06
05
04
03
CAPITAL EXPENDITURES
in millions of dollars
0.74
0.66
0.58
0.50
0.42
07
06
05
04
03
DIVIDENDS DECLARED
per share in dollars
SYSCO Corporation><page