Sysco 2007 Annual Report Download - page 80
Download and view the complete annual report
Please find page 80 of the 2007 Sysco annual report below. You can navigate through the pages in the report by either clicking on the pages listed below, or by using the keyword search tool below to find specific information within the annual report.-
 1
1 -
2
-
3
-
4
-
5
-
6
-
7
-
8
-
9
-
10
-
11
-
12
-
13
-
14
-
15
-
16
-
17
-
18
-
19
-
20
-
21
-
22
-
23
-
24
-
25
-
26
-
27
-
28
-
29
-
30
-
31
-
32
-
33
-
34
-
35
-
36
-
37
-
38
-
39
-
40
-
41
-
42
-
43
-
44
-
45
-
46
-
47
-
48
-
49
-
50
-
51
-
52
-
53
-
54
-
55
-
56
-
57
-
58
-
59
-
60
-
61
-
62
-
63
-
64
-
65
-
66
-
67
-
68
-
69
-
 70
70 -
 71
71 -
 72
72 -
 73
73 -
 74
74 -
 75
75 -
 76
76 -
 77
77 -
 78
78 -
 79
79 -
 80
80 -
 81
81 -
 82
82 -
 83
83 -
 84
84 -
 85
85 -
 86
86 -
 87
87 -
 88
88 -
 89
89 -
 90
90 -
91
-
92
-
93
-
94
-
95
-
96
-
97
-
98
-
99
-
100
-
101
-
102
-
103
-
104
-
105
-
106
-
107
-
108
 |
 |

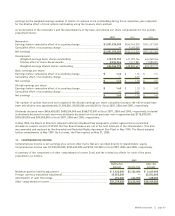
Weighted-average assumptions used to determine net pension costs and other postretirement benefit costs for each fiscal
year were:
2007 2006 2005 2007 2006 2005
Pension Benefits Other Postretirement Plans
Discount rate — All Plans ______________________________________ 6.73% 5.60% 6.25% 6.73% 5.60% 6.25%
Expected rate of return ________________________________________ 9.00 9.00 9.00 N/A N/A N/A
Rate of compensation increase — Retirement Plan _________________ 6.17 5.89 5.89 N/A N/A N/A
For determining net pension costs related to the SERP for each fiscal year, the calculations for fiscal 2007, 2006 and 2005
assume annual salary increases of 10% through fiscal 2007 and 7% thereafter.
A healthcare cost trend rate is not used in the calculations of postretirement benefits obligations because SYSCO
subsidizes the cost of postretirement medical coverage by a fixed dollar amount with the retiree responsible for the
cost of coverage in excess of the subsidy, including all future cost increases.
For guidance in determining the discount rate, SYSCO calculates the implied rate of return on a hypothetical portfolio
of high-quality fixed-income investments for which the timing and amount of cash outflows approximates the estimated
payouts of the pension plans. The discount rate assumption is reviewed annually and revised as deemed appropriate.
The discount rate to be used for the calculation of fiscal 2008 net benefit costs for the Retirement Plan and Other
Postretirement Plans is 6.78%. The discount rate to be used for the calculation of fiscal 2008 net benefit costs for the
SERP is 6.64%. As noted above, the fiscal 2008 discount rates are based on a measurement date of June 30, 2007.
The expected long-term rate of return on plan assets is derived from a mathematical asset model that incorporates
assumptions as to the various asset class returns, reflecting a combination of rigorous historical performance analysis
and the forward-looking views of the financial markets regarding the yield on long-term bonds and the historical returns
of the major stock markets. The rate of return assumption is reviewed annually and revised as deemed appropriate.
The expected long-term rate of return to be used in the calculation of fiscal 2008 net benefit costs for the Retirement Plan
is 8.50%.
The measurement date for the pension and other postretirement benefit plans is fiscal year-end for fiscal years 2005 and
prior. The measurement date for fiscal 2006 and 2007 was May 31st. As discussed above under SFAS 158 Adoption,an
additional measurement was performed as of June 30, 2007. The measurement date for all future periods will correspond
with fiscal year-end.
Investment Policy and Assets
SYSCO’s investment objectives target a mix of investments that can potentially achieve an above-average rate of return.
SYSCO has determined that this strategy is appropriate due to the relatively low ratio of retirees as a percentage of
participants, low average years of participant service and low average age of participants and is willing to accept the
above-average level of short-term risk and variability in returns to attempt to achieve a higher level of long-term returns.
As a result, the company’s strategy targets a mix of investments that include 70% stocks (including a mix of large
capitalization U.S. stocks, small- to mid-capitalization U.S. stocks and international stocks) and 30% fixed income
investments and cash equivalents.
The percentage of the fair value of plan assets by asset category is as follows:
June 30, 2007 July 1, 2006
Equity securities ____________________________________________________________________ 72.0% 70.9%
Debt securities______________________________________________________________________ 28.0 29.1
Total ______________________________________________________________________________ 100.0% 100.0%
11. SHAREHOLDERS’ EQUITY
Basic earnings per share has been computed by dividing net earnings by the weighted average number of shares of
common stock outstanding for each respective year. Diluted earnings per share has been computed by dividing net
page 54 ][ SYSCO Corporation