Sysco 2007 Annual Report Download - page 35
Download and view the complete annual report
Please find page 35 of the 2007 Sysco annual report below. You can navigate through the pages in the report by either clicking on the pages listed below, or by using the keyword search tool below to find specific information within the annual report.-
 1
1 -
2
-
3
-
4
-
5
-
6
-
7
-
8
-
9
-
10
-
11
-
12
-
13
-
14
-
15
-
16
-
17
-
18
-
19
-
20
-
21
-
22
-
23
-
24
-
 25
25 -
 26
26 -
 27
27 -
 28
28 -
 29
29 -
 30
30 -
 31
31 -
 32
32 -
 33
33 -
 34
34 -
 35
35 -
 36
36 -
 37
37 -
 38
38 -
 39
39 -
 40
40 -
 41
41 -
 42
42 -
 43
43 -
 44
44 -
 45
45 -
46
-
47
-
48
-
49
-
50
-
51
-
52
-
53
-
54
-
55
-
56
-
57
-
58
-
59
-
60
-
61
-
62
-
63
-
64
-
65
-
66
-
67
-
68
-
69
-
70
-
71
-
72
-
73
-
74
-
75
-
76
-
77
-
78
-
79
-
80
-
81
-
82
-
83
-
84
-
85
-
86
-
87
-
88
-
89
-
90
-
91
-
92
-
93
-
94
-
95
-
96
-
97
-
98
-
99
-
100
-
101
-
102
-
103
-
104
-
105
-
106
-
107
-
108
 |
 |

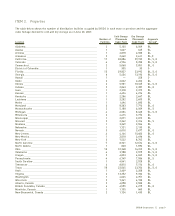
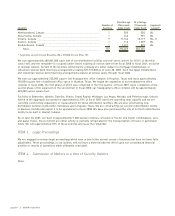
ITEM 2. Properties
The table below shows the number of distribution facilities occupied by SYSCO in each state or province and the aggregate
cubic footage devoted to cold and dry storage as of June 30, 2007.
Location
Number of
Facilities
Cold Storage
(Thousands
Cubic Feet)
Dry Storage
(Thousands
Cubic Feet)
Segments
Served*
Alabama______________________________________________________ 2 5,100 6,049 BL
Alaska _______________________________________________________ 1 1,067 645 BL
Arizona_______________________________________________________ 1 2,818 2,588 BL
Arkansas _____________________________________________________ 2 2,660 2,611 BL,O
California _____________________________________________________ 17 28,886 29,733 BL, S, O
Colorado _____________________________________________________ 4 6,926 5,390 BL, S, O
Connecticut ___________________________________________________ 2 5,068 3,851 BL, O
District of Columbia ____________________________________________ 1 335 30 O
Florida _______________________________________________________ 15 29,827 23,992 BL, S, O
Georgia_______________________________________________________ 6 5,434 13,190 BL, S, O
Hawaii _______________________________________________________ 1 — 258 O
Idaho ________________________________________________________ 2 2,032 2,202 BL
Illinois _______________________________________________________ 6 5,981 10,345 BL, S, O
Indiana _______________________________________________________ 2 2,843 2,387 BL, O
Iowa _________________________________________________________ 1 2,318 2,373 BL
Kansas _______________________________________________________ 1 4,424 4,274 BL
Kentucky _____________________________________________________ 1 2,286 2,647 BL
Louisiana _____________________________________________________ 1 3,282 2,605 BL
Maine ________________________________________________________ 1 1,494 1,895 BL
Maryland _____________________________________________________ 3 8,383 7,770 BL, O
Massachusetts ________________________________________________ 2 5,188 6,009 BL, S
Michigan _____________________________________________________ 4 6,504 8,468 BL, S, O
Minnesota ____________________________________________________ 2 4,415 3,772 BL
Mississippi ____________________________________________________ 1 2,071 2,073 BL
Missouri ______________________________________________________ 2 2,242 2,316 BL, S
Montana ______________________________________________________ 1 3,269 2,556 BL
Nebraska _____________________________________________________ 1 1,721 2,130 BL
Nevada _______________________________________________________ 3 6,010 3,677 BL, O
New Jersey ___________________________________________________ 4 4,144 10,400 BL, O
New Mexico ___________________________________________________ 1 3,018 2,696 BL
New York _____________________________________________________ 3 7,522 8,762 BL
North Carolina ________________________________________________ 7 8,731 12,674 BL, S, O
North Dakota__________________________________________________ 1 830 1,893 BL
Ohio _________________________________________________________ 10 10,368 14,313 BL, S, O
Oklahoma ____________________________________________________ 4 3,788 3,579 BL, S, O
Oregon _______________________________________________________ 3 4,023 4,063 BL, S, O
Pennsylvania __________________________________________________ 4 6,749 7,586 BL, S
South Carolina ________________________________________________ 1 4,541 2,928 BL
Tennessee ____________________________________________________ 4 8,810 7,174 BL, O
Texas ________________________________________________________ 18 23,045 23,704 BL, S, O
Utah _________________________________________________________ 1 3,609 3,208 BL
Virginia _______________________________________________________ 3 13,252 9,786 BL
Washington ___________________________________________________ 1 4,025 2,751 BL
Wisconsin ____________________________________________________ 2 7,261 6,155 BL
Alberta, Canada _______________________________________________ 2 4,098 3,550 BL
British Columbia, Canada _______________________________________ 6 4,595 4,279 BL, O
Manitoba, Canada ______________________________________________ 1 1,135 860 BL
New Brunswick, Canada ________________________________________ 2 1,124 1,430 BL
SYSCO Corporation ][ page 9