Sysco 2007 Annual Report Download - page 92
Download and view the complete annual report
Please find page 92 of the 2007 Sysco annual report below. You can navigate through the pages in the report by either clicking on the pages listed below, or by using the keyword search tool below to find specific information within the annual report.-
 1
1 -
2
-
3
-
4
-
5
-
6
-
7
-
8
-
9
-
10
-
11
-
12
-
13
-
14
-
15
-
16
-
17
-
18
-
19
-
20
-
21
-
22
-
23
-
24
-
25
-
26
-
27
-
28
-
29
-
30
-
31
-
32
-
33
-
34
-
35
-
36
-
37
-
38
-
39
-
40
-
41
-
42
-
43
-
44
-
45
-
46
-
47
-
48
-
49
-
50
-
51
-
52
-
53
-
54
-
55
-
56
-
57
-
58
-
59
-
60
-
61
-
62
-
63
-
64
-
65
-
66
-
67
-
68
-
69
-
70
-
71
-
72
-
73
-
74
-
75
-
76
-
77
-
78
-
79
-
80
-
81
-
 82
82 -
 83
83 -
 84
84 -
 85
85 -
 86
86 -
 87
87 -
 88
88 -
 89
89 -
 90
90 -
 91
91 -
 92
92 -
 93
93 -
 94
94 -
 95
95 -
 96
96 -
 97
97 -
 98
98 -
 99
99 -
 100
100 -
 101
101 -
 102
102 -
103
-
104
-
105
-
106
-
107
-
108
 |
 |

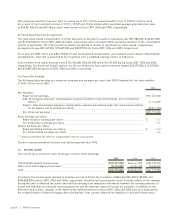
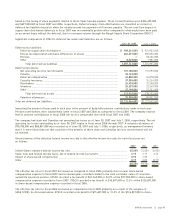
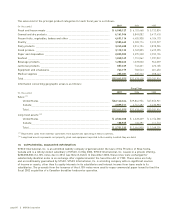
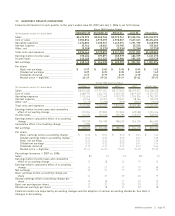
The sales mix for the principal product categories for each fiscal year is as follows:
(In thousands) 2007 2006 2005
Fresh and frozen meats ________________________________________________ $ 6,548,127 $ 6,153,468 $ 5,732,834
Canned and dry products _______________________________________________ 6,161,946 5,849,082 5,417,418
Frozen fruits, vegetables, bakery and other _______________________________ 4,691,114 4,405,908 4,104,170
Poultry_______________________________________________________________ 3,585,462 3,283,174 3,222,927
Dairy products ________________________________________________________ 3,245,488 3,014,104 2,878,904
Fresh produce ________________________________________________________ 3,118,122 2,769,805 2,459,295
Paper and disposables _________________________________________________ 2,825,505 2,595,358 2,353,104
Seafood ______________________________________________________________ 1,840,149 1,751,062 1,591,022
Beverage products_____________________________________________________ 1,200,263 1,078,030 962,039
Janitorial products ____________________________________________________ 857,339 740,601 670,105
Equipment and smallwares _____________________________________________ 763,179 782,523 681,653
Medical supplies ______________________________________________________ 205,381 205,323 208,443
Total _________________________________________________________________ $35,042,075 $32,628,438 $30,281,914
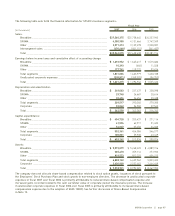
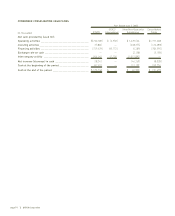
Information concerning geographic areas is as follows:
(In thousands) 2007 2006 2005
Fiscal Year
Sales:
(1)
United States _____________________________________________________ $32,142,364 $29,866,956 $27,850,921
Canada ___________________________________________________________ 2,899,711 2,761,482 2,430,993
Total _____________________________________________________________ $35,042,075 $32,628,438 $30,281,914
Long-lived assets:
(2)
United States _____________________________________________________ $ 2,532,308 $ 2,328,609 $ 2,156,588
Canada ___________________________________________________________ 188,925 136,291 111,713
Total _____________________________________________________________ $ 2,721,233 $ 2,464,900 $ 2,268,301
(1)
Represents sales from external customers from businesses operating in these countries.
(2)
Long-lived assets represents net property, plant and equipment reported in the country in which they are held.
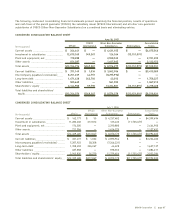
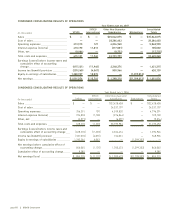
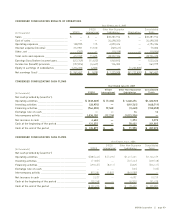
18. SUPPLEMENTAL GUARANTOR INFORMATION
SYSCO International, Co. is an unlimited liability company organized under the laws of the Province of Nova Scotia,
Canada and is a wholly-owned subsidiary of SYSCO. In May 2002, SYSCO International, Co. issued, in a private offering,
$200,000,000 of 6.10% notes due in 2012 (see Note 8, Debt). In December 2002, these notes were exchanged for
substantially identical notes in an exchange offer registered under the Securities Act of 1933. These notes are fully
and unconditionally guaranteed by SYSCO. SYSCO International, Co. is a holding company with no significant sources
of income or assets, other than its equity interests in its subsidiaries and interest income from loans made to its
subsidiaries. The proceeds from the issuance of the 6.10% notes were used to repay commercial paper issued to fund the
fiscal 2002 acquisition of a Canadian broadline foodservice operation.
page 66 ][ SYSCO Corporation