Sysco 2007 Annual Report Download - page 20
Download and view the complete annual report
Please find page 20 of the 2007 Sysco annual report below. You can navigate through the pages in the report by either clicking on the pages listed below, or by using the keyword search tool below to find specific information within the annual report.-
 1
1 -
2
-
3
-
4
-
5
-
6
-
7
-
8
-
9
-
 10
10 -
 11
11 -
 12
12 -
 13
13 -
 14
14 -
 15
15 -
 16
16 -
 17
17 -
 18
18 -
 19
19 -
 20
20 -
 21
21 -
 22
22 -
 23
23 -
 24
24 -
 25
25 -
 26
26 -
 27
27 -
 28
28 -
 29
29 -
 30
30 -
31
-
32
-
33
-
34
-
35
-
36
-
37
-
38
-
39
-
40
-
41
-
42
-
43
-
44
-
45
-
46
-
47
-
48
-
49
-
50
-
51
-
52
-
53
-
54
-
55
-
56
-
57
-
58
-
59
-
60
-
61
-
62
-
63
-
64
-
65
-
66
-
67
-
68
-
69
-
70
-
71
-
72
-
73
-
74
-
75
-
76
-
77
-
78
-
79
-
80
-
81
-
82
-
83
-
84
-
85
-
86
-
87
-
88
-
89
-
90
-
91
-
92
-
93
-
94
-
95
-
96
-
97
-
98
-
99
-
100
-
101
-
102
-
103
-
104
-
105
-
106
-
107
-
108
 |
 |

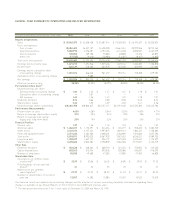
ELEVEN - YEAR SUMMARY OF OPERATIONS AND RELATED INFORMATION
(Dollars in thousands except for per share data)
2007 2006 2005 2004 2003 2002
Results of Operations
Sales $ 35,042,075 $ 32,628,438 $ 30,281,914 $ 29,335,403 $ 26,140,337 $ 23,350,504
Costs and expenses
Cost of sales 28,284,603 26,337,107 24,498,200 23,661,514 20,979,556 18,722,163
Operating expenses 5,048,990 4,796,301 4,194,184 4,141,230 3,836,507 3,467,379
Interest expense 105,002 109,100 75,000 69,880 72,234 62,897
Other, net (17,735) (9,016) (10,906) (12,365) (8,347) (2,805)
Total costs and expenses 33,420,860 31,233,492 28,756,478 27,860,259 24,879,950 22,249,634
Earnings before income taxes 1,621,215 1,394,946 1,525,436 1,475,144 1,260,387 1,100,870
Income taxes 620,139 548,906 563,979 567,930 482,099 421,083
Earnings before cumulative effect
of accounting change 1,001,076 846,040 961,457 907,214 778,288 679,787
Cumulative effect of accounting change — 9,285 — — — —
Net earnings $ 1,001,076 $ 855,325 $ 961,457 $ 907,214 $ 778,288 $ 679,787
Effective income tax rate 38.25% 39.35% 36.97% 38.50% 38.25% 38.25%
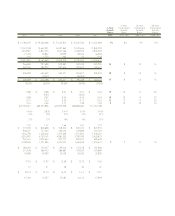
Per Common Share Data
(1)
Diluted earnings per share:
Earnings before accounting change $ 1.60 $ 1.35 $ 1.47 $ 1.37 $ 1.18 $ 1.01
Cumulative effect of accounting change —0.01 — — — —
Net earnings 1.60 1.36 1.47 1.37 1.18 1.01
Dividends declared 0.74 0.66 0.58 0.50 0.42 0.34
Shareholders’ equity 5.36 4.93 4.39 4.03 3.41 3.26
Diluted average shares outstanding 626,366,798 628,800,647 653,157,117 661,919,234 661,535,382 673,445,783
Performance Measurements
Pretax return on sales 4.63% 4.28% 5.04% 5.03% 4.82% 4.71%
Return on average shareholders’ equity 31% 30% 35% 39% 36% 31%
Return on average total capital
(equity plus long-term debt) 20% 19% 23% 25% 23% 21%
Financial Position
Current ratio 1.37 1.36 1.16 1.23 1.34 1.52
Working capital $ 1,260,457 $ 1,173,291 $ 544,216 $ 724,777 $ 928,405 $ 1,082,925
Other assets 2,122,152 2,127,431 1,997,815 1,829,412 1,384,327 1,138,682
Plant and equipment (net) 2,721,233 2,464,900 2,268,301 2,166,809 1,922,660 1,697,782
Total assets 9,518,931 8,992,025 8,267,902 7,847,632 6,936,521 5,989,753
Long-term debt 1,758,227 1,627,127 956,177 1,231,493 1,249,467 1,176,307
Shareholders’ equity 3,278,400 3,052,284 2,758,839 2,564,506 2,197,531 2,132,519
Other Data
Dividends declared $ 456,438 $ 408,264 $ 368,792 $ 321,353 $ 273,852 $ 225,530
Capital expenditures 603,242 513,934 390,026 530,086 435,637 416,393
Number of employees 50,900 49,600 47,500 47,800 47,400 46,800
Shareholder Data
Closing price of common share
at year end
(1)
$ 32.99 $ 30.56 $ 36.25 $ 34.80 $ 29.55 $ 27.22
Price/earnings ratio at year end -
diluted
(1)
21 23 25 25 25 27
Market price per common
share-high/low
(1)
$ 37-27 $ 37-29 $ 38-29 $ 41-29 $ 33-21 $ 30-22
Number of shareholders of record at
year end 13,557 14,282 15,083 15,337 15,533 15,510
Our financial results are impacted by accounting changes and the adoption of various accounting standards. Information regarding these
changes is available in our Annual Reports on Form 10-K for fiscal 2007 and previous years.
(1)
The data presented reflects the 2-for-1 stock splits of December 15, 2000 and March 20, 1998.