Sysco 2007 Annual Report Download - page 97
Download and view the complete annual report
Please find page 97 of the 2007 Sysco annual report below. You can navigate through the pages in the report by either clicking on the pages listed below, or by using the keyword search tool below to find specific information within the annual report.-
 1
1 -
2
-
3
-
4
-
5
-
6
-
7
-
8
-
9
-
10
-
11
-
12
-
13
-
14
-
15
-
16
-
17
-
18
-
19
-
20
-
21
-
22
-
23
-
24
-
25
-
26
-
27
-
28
-
29
-
30
-
31
-
32
-
33
-
34
-
35
-
36
-
37
-
38
-
39
-
40
-
41
-
42
-
43
-
44
-
45
-
46
-
47
-
48
-
49
-
50
-
51
-
52
-
53
-
54
-
55
-
56
-
57
-
58
-
59
-
60
-
61
-
62
-
63
-
64
-
65
-
66
-
67
-
68
-
69
-
70
-
71
-
72
-
73
-
74
-
75
-
76
-
77
-
78
-
79
-
80
-
81
-
82
-
83
-
84
-
85
-
86
-
 87
87 -
 88
88 -
 89
89 -
 90
90 -
 91
91 -
 92
92 -
 93
93 -
 94
94 -
 95
95 -
 96
96 -
 97
97 -
 98
98 -
 99
99 -
 100
100 -
 101
101 -
 102
102 -
 103
103 -
 104
104 -
 105
105 -
 106
106 -
 107
107 -
108
 |
 |

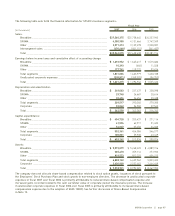
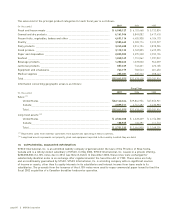
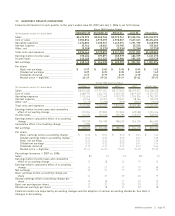
19. QUARTERLY RESULTS (UNAUDITED)
Financial information for each quarter in the years ended June 30, 2007 and July 1, 2006 is set forth below:
(In thousands except for share data) September 30 December 30 March 31 June 30 Fiscal Year
Fiscal 2007 Quarter Ended
Sales ______________________________________ $8,672,072 $8,568,748 $8,572,961 $9,228,294 $35,042,075
Cost of sales ________________________________ 7,002,856 6,915,259 6,938,867 7,427,621 28,284,603
Operating expenses __________________________ 1,276,882 1,230,967 1,249,951 1,291,190 5,048,990
Interest expense ____________________________ 25,766 28,006 25,700 25,530 105,002
Other, net __________________________________ (9,038) (3,375) (2,536) (2,786) (17,735)
Total costs and expenses _____________________ 8,296,466 8,170,857 8,211,982 8,741,555 33,420,860
Earnings before income taxes _________________ 375,606 397,891 360,979 486,739 1,621,215
Income taxes _______________________________ 145,458 151,353 139,980 183,348 620,139
Net earnings ________________________________ $ 230,148 $ 246,538 $ 220,999 $ 303,391 $ 1,001,076
Per share:
Basic net earnings _______________________ $ 0.37 $ 0.40 $ 0.36 $ 0.49 $ 1.62
Diluted net earnings _____________________ 0.37 0.39 0.35 0.49 1.60
Dividends declared_______________________ 0.17 0.19 0.19 0.19 0.74
Market price — high/low __________________ 34-27 37-32 37-31 35-32 37-27
(In thousands except for share data) October 1 December 31 April 1 July 1 Fiscal Year
Fiscal 2006 Quarter Ended
Sales ______________________________________ $8,010,484 $7,971,061 $8,137,816 $8,509,077 $32,628,438
Cost of sales ________________________________ 6,480,793 6,434,753 6,602,102 6,819,459 26,337,107
Operating expenses __________________________ 1,176,656 1,171,469 1,193,270 1,254,906 4,796,301
Interest expense_____________________________ 22,246 29,227 29,441 28,186 109,100
Other, net __________________________________ (3,115) (2,220) (819) (2,862) (9,016)
Total costs and expenses _____________________ 7,676,580 7,633,229 7,823,994 8,099,689 31,233,492
Earnings before income taxes and cumulative
effect of accounting change _________________ 333,904 337,832 313,822 409,388 1,394,946
Income taxes ________________________________ 134,694 133,650 125,283 155,279 548,906
Earnings before cumulative effect of accounting
change ___________________________________ 199,210 204,182 188,539 254,109 846,040
Cumulative effect of accounting change _________ 9,285 — — — 9,285
Net earnings ________________________________ $ 208,495 $ 204,182 $ 188,539 $ 254,109 $ 855,325
Per share:
Basic earnings before accounting change ___ $ 0.32 $ 0.33 $ 0.30 $ 0.41 $ 1.36
Diluted earnings before accounting change __ 0.31 0.33 0.30 0.41 1.35
Basic net earnings _______________________ 0.33 0.33 0.30 0.41 1.38
Diluted net earnings _____________________ 0.33 0.33 0.30 0.41 1.36
Dividends declared _______________________ 0.15 0.17 0.17 0.17 0.66
Market price — high/low __________________ 37-31 34-30 33-29 32-29 37-29
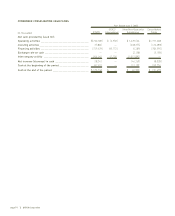
Percentage increases — 2007 vs. 2006:
Sales ______________________________________ 8% 7% 5% 8% 7%
Earnings before income taxes and cumulative
effect of accounting change _________________ 12 18 15 19 16
Earnings before cumulative effect of accounting
change ___________________________________ 16 21 17 19 18
Net earnings ________________________________ 10 21 17 19 17
Basic earnings before accounting change per
share ____________________________________ 16 21 20 20 19
Diluted earnings before accounting change per
share ____________________________________ 19 18 17 20 19
Basic net earnings per share __________________ 12 21 20 20 17
Diluted net earnings per share ________________ 12 18 17 20 18
Financial results are impacted by accounting changes and the adoption of various accounting standards. See Note 2,
Changes in Accounting.
SYSCO Corporation ][ page 71