Sysco 2007 Annual Report Download - page 47
Download and view the complete annual report
Please find page 47 of the 2007 Sysco annual report below. You can navigate through the pages in the report by either clicking on the pages listed below, or by using the keyword search tool below to find specific information within the annual report.-
 1
1 -
2
-
3
-
4
-
5
-
6
-
7
-
8
-
9
-
10
-
11
-
12
-
13
-
14
-
15
-
16
-
17
-
18
-
19
-
20
-
21
-
22
-
23
-
24
-
25
-
26
-
27
-
28
-
29
-
30
-
31
-
32
-
33
-
34
-
35
-
36
-
 37
37 -
 38
38 -
 39
39 -
 40
40 -
 41
41 -
 42
42 -
 43
43 -
 44
44 -
 45
45 -
 46
46 -
 47
47 -
 48
48 -
 49
49 -
 50
50 -
 51
51 -
 52
52 -
 53
53 -
 54
54 -
 55
55 -
 56
56 -
 57
57 -
58
-
59
-
60
-
61
-
62
-
63
-
64
-
65
-
66
-
67
-
68
-
69
-
70
-
71
-
72
-
73
-
74
-
75
-
76
-
77
-
78
-
79
-
80
-
81
-
82
-
83
-
84
-
85
-
86
-
87
-
88
-
89
-
90
-
91
-
92
-
93
-
94
-
95
-
96
-
97
-
98
-
99
-
100
-
101
-
102
-
103
-
104
-
105
-
106
-
107
-
108
 |
 |
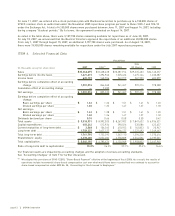
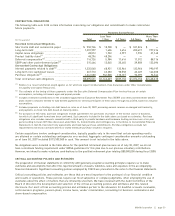
term debt to total capitalization ratio between 35% and 40%. The ratio may exceed the target range from time to time,
due to borrowings incurred in order to fund acquisitions and internal growth opportunities, and due to fluctuations in the
timing and amount of share repurchases. The ratio also may fall below the target range due to strong cash flow from
operations and fluctuations in the timing and amount of share repurchases. This ratio was 35.0% and 36.2% as of June 30,
2007 and July 1, 2006, respectively. For purposes of calculating this ratio, long-term debt includes both the current
maturities and long-term portion.
We believe that our cash flows from operations, as well as the availability of additional capital under our existing
commercial paper programs, bank lines of credit, debt shelf registration and our ability to access capital from financial
markets in the future, will be sufficient to meet our cash requirements while maintaining proper liquidity for normal
operating purposes.
Operating Activities
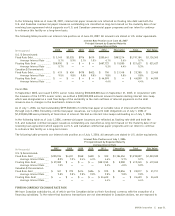
We generated $1,402,922,000 in cash flow from operations in fiscal 2007, $1,124,679,000 in fiscal 2006 and $1,191,208,000
in fiscal 2005. Increases in our cash flow from operations are primarily due to increased earnings offset by investments in
working capital.
Cash flow from operations in fiscal 2007, fiscal 2006 and fiscal 2005 was reduced by increases in inventory balances and
increases in accounts receivable balances, offset by an increase in accounts payable balances. The increases in accounts
receivable and inventory balances were primarily due to sales growth. The accounts payable balances did not increase at
the same rate as inventory increases. Accounts payable balances are impacted by many factors, including changes in
product mix, cash discount terms and changes in payment terms with vendors due to the use of more efficient electronic
payment methods.
Accrued expenses increased $132,936,000 during fiscal 2007, increased $29,161,000 during fiscal 2006, and decreased
$52,423,000 during fiscal 2005. The increase in accrued expenses during fiscal 2007 was primarily due to increased
accruals for current year incentive bonuses due to improved operating results over the prior year. The increase in accrued
expenses during fiscal 2006 was related to various miscellaneous accruals. The decrease in accrued expenses during
fiscal 2005 was primarily due to the amount of accrued incentive bonuses related to that year.
Also affecting the increase in accrued expenses and the increase in prepaid expenses and other current assets during
fiscal 2007 was the recording of the product liability claim of $50,296,000 and corresponding receivable of $48,296,000.
Cash flow from operations was not negatively affected, as these items mostly offset. See further discussion of the product
liability claim under Other Considerations.
Other long-term liabilities and prepaid pension cost, net, increased $14,817,000 during fiscal 2007, decreased $75,382,000
in fiscal 2006 and increased $86,338,000 in fiscal 2005. The change in these accounts was primarily attributable to the
recording of net pension costs and the timing and amount of pension contributions to our company-sponsored plans.
In fiscal 2007, our pension contributions exceeded the amount of net pension costs recognized during the year resulting
in a net cash outflow. In fiscal 2006 and 2005, the net pension costs recorded exceeded the amount of pension
contributions during the year resulting in a net cash inflow.
One of the factors increasing the amount of taxes paid in fiscal 2007 and fiscal 2006, as compared to the amounts paid
in fiscal 2005, was the amount of deductible pension contributions made during the year. Our contributions to our defined
benefit plans were $91,163,000, $73,764,000 and $220,361,000 during fiscal 2007, fiscal 2006 and fiscal 2005, respectively.
We expect to contribute approximately $92,000,000 to our defined benefit plans in fiscal 2008. Also impacting taxes paid
is the net cash flow impact of supply chain distribution deferrals for fiscal 2007, fiscal 2006 and fiscal 2005, being
incrementally positive when compared to what would have been paid on an annual basis without the deferral, due
to increased volume through BSCC.
Investing Activities
Fiscal 2007 capital expenditures included:
• construction of fold-out facilities in Springfield, Illinois and Raleigh, North Carolina;
• replacement or significant expansion of facilities in Miami, Florida, Albuquerque, New Mexico, Columbia,
South Carolina, Kansas City, Kansas, and Riviera Beach, Florida;
SYSCO Corporation ][ page 21