Sysco 2007 Annual Report Download - page 41
Download and view the complete annual report
Please find page 41 of the 2007 Sysco annual report below. You can navigate through the pages in the report by either clicking on the pages listed below, or by using the keyword search tool below to find specific information within the annual report.-
 1
1 -
2
-
3
-
4
-
5
-
6
-
7
-
8
-
9
-
10
-
11
-
12
-
13
-
14
-
15
-
16
-
17
-
18
-
19
-
20
-
21
-
22
-
23
-
24
-
25
-
26
-
27
-
28
-
29
-
30
-
 31
31 -
 32
32 -
 33
33 -
 34
34 -
 35
35 -
 36
36 -
 37
37 -
 38
38 -
 39
39 -
 40
40 -
 41
41 -
 42
42 -
 43
43 -
 44
44 -
 45
45 -
 46
46 -
 47
47 -
 48
48 -
 49
49 -
 50
50 -
 51
51 -
52
-
53
-
54
-
55
-
56
-
57
-
58
-
59
-
60
-
61
-
62
-
63
-
64
-
65
-
66
-
67
-
68
-
69
-
70
-
71
-
72
-
73
-
74
-
75
-
76
-
77
-
78
-
79
-
80
-
81
-
82
-
83
-
84
-
85
-
86
-
87
-
88
-
89
-
90
-
91
-
92
-
93
-
94
-
95
-
96
-
97
-
98
-
99
-
100
-
101
-
102
-
103
-
104
-
105
-
106
-
107
-
108
 |
 |

results of operations for fiscal 2006 include incremental share-based compensation cost over what would have
been recorded had the company continued to account for share-based compensation under APB 25 of $118,038,000
($105,810,000, net of tax). Our consolidated results of operations for all future periods will include share-based
compensation cost recorded in accordance with SFAS 123(R).
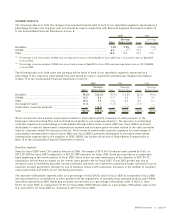
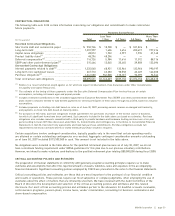
RESULTS OF OPERATIONS
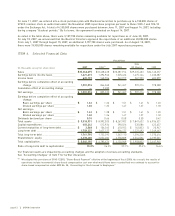
The following table sets forth the components of our consolidated results of operations expressed as a percentage
of sales for the periods indicated:
2007 2006 2005
Sales _________________________________________________________________________________ 100.0% 100.0% 100.0%
Costs and Expenses
Cost of sales _______________________________________________________________________ 80.7 80.7 80.9
Operating expenses _________________________________________________________________ 14.4 14.7 13.9
Interest expense____________________________________________________________________ 0.3 0.3 0.2
Other, net _________________________________________________________________________ 0.0 0.0 0.0
Total costs and expenses ________________________________________________________________ 95.4 95.7 95.0
Earnings before income taxes and cumulative effect of accounting change _____________________ 4.6 4.3 5.0
Income taxes __________________________________________________________________________ 1.7 1.7 1.8
Earnings before cumulative effect of accounting change _____________________________________ 2.9 2.6 3.2
Cumulative effect of accounting change ____________________________________________________ —0.0 —
Net earnings ___________________________________________________________________________ 2.9% 2.6% 3.2%
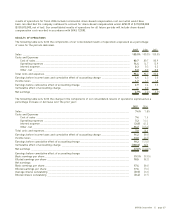
The following table sets forth the change in the components of our consolidated results of operations expressed as a
percentage increase or decrease over the prior year:
2007 2006
Sales _________________________________________________________________________________ 7.4% 7.8%
Costs and Expenses
Cost of sales ______________________________________________________________________ 7.4 7.5
Operating expenses ________________________________________________________________ 5.3 14.4
Interest expense ___________________________________________________________________ (3.8) 45.5
Other, net _________________________________________________________________________ 96.7 (17.3)
Total costs and expenses________________________________________________________________ 7.0 8.6
Earnings before income taxes and cumulative effect of accounting change _____________________ 16.2 (8.6)
Income taxes __________________________________________________________________________ 13.0 (2.7)
Earnings before cumulative effect of accounting change _____________________________________ 18.3 (12.0)
Cumulative effect of accounting change ___________________________________________________ (100.0) N/A
Net earnings __________________________________________________________________________ 17.0% (11.0)%
Earnings before cumulative effect of accounting change:
Basic earnings per share________________________________________________________________ 19.1% (9.9)%
Diluted earnings per share ______________________________________________________________ 18.5 (8.2)
Net earnings:
Basic earnings per share________________________________________________________________ 17.4 (8.6)
Diluted earnings per share ______________________________________________________________ 17.6 (7.5)
Average shares outstanding _____________________________________________________________ (0.5) (2.3)
Diluted shares outstanding ______________________________________________________________ (0.4) (3.7)
SYSCO Corporation ][ page 15