Sysco 2007 Annual Report Download - page 23
Download and view the complete annual report
Please find page 23 of the 2007 Sysco annual report below. You can navigate through the pages in the report by either clicking on the pages listed below, or by using the keyword search tool below to find specific information within the annual report.-
 1
1 -
2
-
3
-
4
-
5
-
6
-
7
-
8
-
9
-
10
-
11
-
12
-
 13
13 -
 14
14 -
 15
15 -
 16
16 -
 17
17 -
 18
18 -
 19
19 -
 20
20 -
 21
21 -
 22
22 -
 23
23 -
 24
24 -
 25
25 -
 26
26 -
 27
27 -
 28
28 -
 29
29 -
 30
30 -
 31
31 -
 32
32 -
 33
33 -
34
-
35
-
36
-
37
-
38
-
39
-
40
-
41
-
42
-
43
-
44
-
45
-
46
-
47
-
48
-
49
-
50
-
51
-
52
-
53
-
54
-
55
-
56
-
57
-
58
-
59
-
60
-
61
-
62
-
63
-
64
-
65
-
66
-
67
-
68
-
69
-
70
-
71
-
72
-
73
-
74
-
75
-
76
-
77
-
78
-
79
-
80
-
81
-
82
-
83
-
84
-
85
-
86
-
87
-
88
-
89
-
90
-
91
-
92
-
93
-
94
-
95
-
96
-
97
-
98
-
99
-
100
-
101
-
102
-
103
-
104
-
105
-
106
-
107
-
108
 |
 |

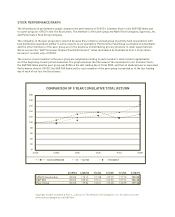
COMPARISON OF 5 YEAR CUMULATIVE TOTAL RETURN
6/29/02 6/28/03 7/3/04 7/2/05 6/30/07
SYSCO CORPORATION S&P 500 PEER GROUP
$0
$20
$40
$60
$80
$100
$120
$140
$160
$180
$200
7/1/06
STOCK PERFORMANCE GRAPH
The following stock performance graph compares the performance of SYSCO’s Common Stock to the S&P 500 Index and
to a peer group for SYSCO’s last five fiscal years. The members of the peer group are Nash Finch Company, Supervalu, Inc.
and Performance Food Group Company.
The companies in the peer group were selected because they comprise a broad group of publicly held corporations with
food distribution operations similar in some respects to our operations. Performance Food Group is a foodservice distributor
and the other members of the peer group are in the business of distributing grocery products to retail supermarkets.
We do not use the “S&P Consumer Staples (Food Distributors)” index maintained by Standard & Poor’s Corporation
because it consists only of SYSCO.
The returns of each member of the peer group are weighted according to each member’s stock market capitalization
as of the beginning of each period measured. The graph assumes that the value of the investment in our Common Stock,
the S&P 500 Index and the peer group was $100 on the last trading day of fiscal 2002, and that all dividends were reinvested.
Performance data for SYSCO, the S&P 500 Index and for each member of the peer group is provided as of the last trading
day of each of our last five fiscal years.
6/29/02 6/28/03 7/3/04 7/2/05 7/1/06 6/30/07
SYSCO Corporation 100.00 110.13 131.98 139.79 119.70 132.03
S&P 500 100.00 100.25 119.41 126.96 137.92 166.32
Peer Group 100.00 99.84 110.51 125.58 118.09 177.76
Copyright © 2007, Standard & Poor’s, a division of The McGraw-Hill Companies, Inc. All rights reserved.
www.researchdatagroup.com/S&P.htm