Sysco 2007 Annual Report Download - page 45
Download and view the complete annual report
Please find page 45 of the 2007 Sysco annual report below. You can navigate through the pages in the report by either clicking on the pages listed below, or by using the keyword search tool below to find specific information within the annual report.-
 1
1 -
2
-
3
-
4
-
5
-
6
-
7
-
8
-
9
-
10
-
11
-
12
-
13
-
14
-
15
-
16
-
17
-
18
-
19
-
20
-
21
-
22
-
23
-
24
-
25
-
26
-
27
-
28
-
29
-
30
-
31
-
32
-
33
-
34
-
 35
35 -
 36
36 -
 37
37 -
 38
38 -
 39
39 -
 40
40 -
 41
41 -
 42
42 -
 43
43 -
 44
44 -
 45
45 -
 46
46 -
 47
47 -
 48
48 -
 49
49 -
 50
50 -
 51
51 -
 52
52 -
 53
53 -
 54
54 -
 55
55 -
56
-
57
-
58
-
59
-
60
-
61
-
62
-
63
-
64
-
65
-
66
-
67
-
68
-
69
-
70
-
71
-
72
-
73
-
74
-
75
-
76
-
77
-
78
-
79
-
80
-
81
-
82
-
83
-
84
-
85
-
86
-
87
-
88
-
89
-
90
-
91
-
92
-
93
-
94
-
95
-
96
-
97
-
98
-
99
-
100
-
101
-
102
-
103
-
104
-
105
-
106
-
107
-
108
 |
 |

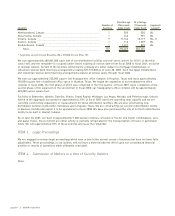
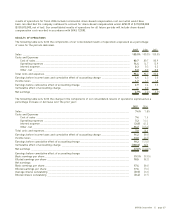
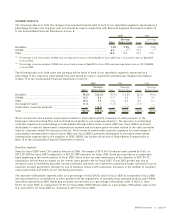
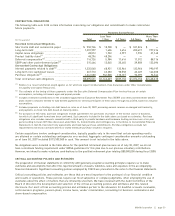
SEGMENT RESULTS
The following table sets forth the change in the selected financial data of each of our reportable segments expressed as a
percentage increase over the prior year and should be read in conjunction with Business Segment Information in Note 17
to the Consolidated Financial Statements in Item 8:
Sales
Earnings
Before Taxes Sales
Earnings
Before Taxes
2007 2006
Broadline ____________________________________________________________ 7.0% 9.5% 5.8% 2.0%
SYGMA ______________________________________________________________ 6.0 —
(1)
10.3 —
(2)
Other________________________________________________________________ 13.8 7.1 23.7 27.5
(1)
Percentage is not meaningful. SYGMA had earnings before taxes of $10,393,000 in fiscal 2007 and a loss before taxes of $660,000
in fiscal 2006.
(2)
Percentage is not meaningful. SYGMA had a loss before taxes of $660,000 in fiscal 2006 and earnings before taxes of $11,028,000
in fiscal 2005.
The following table sets forth sales and earnings before taxes of each of our reportable segments expressed as a
percentage of the respective consolidated total and should be read in conjunction with Business Segment Information
in Note 17 to the Consolidated Financial Statements in Item 8:
Sales
Earnings
Before Taxes Sales
Earnings
Before Taxes Sales
Earnings
Before Taxes
2007 2006 2005
Broadline _______________________________________ 78.6% 104.4% 78.9% 110.8% 80.3% 99.4%
SYGMA _________________________________________ 12.5 0.6 12.7 0.0 12.4 0.7
Other ___________________________________________ 10.2 7.9 9.6 8.5 8.4 6.1
Intersegment sales _______________________________ (1.3) — (1.2) — (1.1) —
Unallocated corporate expenses ___________________ — (12.9) — (19.3) — (6.2)
Total ___________________________________________ 100.0% 100.0% 100.0% 100.0% 100.0% 100.0%
We do not allocate share-based compensation related to stock option grants, issuances of stock pursuant to the
Employees’ Stock Purchase Plan and restricted stock grants to non-employee directors. The decrease in unallocated
corporate expenses as a percentage of consolidated earnings before taxes in fiscal 2007 over fiscal 2006 is primarily
attributable to reduced share-based compensation expense and increased gains recorded related to the cash surrender
value of corporate-owned life insurance policies. The increase in unallocated corporate expenses as a percentage of
consolidated earnings before taxes in fiscal 2006 over fiscal 2005 is primarily attributable to increased share-based
compensation expense due to the adoption of SFAS 123(R). See further discussion of Share-Based Compensation in
Note 13 to the Consolidated Financial Statements in Item 8.
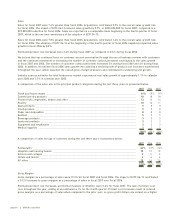
Broadline Segment
Sales for fiscal 2007 were 7.0% greater than fiscal 2006. The impact of EITF 04-13 reduced sales growth by 0.4%, or
$173,171,000 for fiscal 2007 compared to a $57,211,000 reduction for fiscal 2006. Sales are reported on a comparable
basis beginning in the fourth quarter of fiscal 2007, which is the one-year anniversary of the adoption of EITF 04-13.
Acquisitions did not have an impact on the overall sales growth rate for fiscal 2007. Fiscal 2007 growth was due to
increased sales to marketing associate-served customers and multi-unit customers primarily through continued focus on
customer account penetration through the use of business reviews with customers, increases in the number of customer
contact personnel and efforts of our marketing associates.
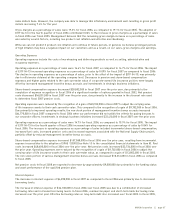
The decrease of Broadline segment sales as a percentage of total SYSCO sales in fiscal 2007 as compared to fiscal 2006
was due primarily to contributions to sales growth from the acquisitions of specialty meat, specialty produce and SYGMA
operations during fiscal 2006. Marketing associate-served sales as a percentage of Broadline sales in the U.S. were
52.0% for fiscal 2007, as compared to 51.9% for fiscal 2006. SYSCO Brand sales as a percentage of Broadline sales in the
U.S. were 45.5% for fiscal 2007 as compared to 48.1% for fiscal 2006.
SYSCO Corporation ][ page 19