Sysco 2007 Annual Report Download - page 42
Download and view the complete annual report
Please find page 42 of the 2007 Sysco annual report below. You can navigate through the pages in the report by either clicking on the pages listed below, or by using the keyword search tool below to find specific information within the annual report.-
 1
1 -
2
-
3
-
4
-
5
-
6
-
7
-
8
-
9
-
10
-
11
-
12
-
13
-
14
-
15
-
16
-
17
-
18
-
19
-
20
-
21
-
22
-
23
-
24
-
25
-
26
-
27
-
28
-
29
-
30
-
31
-
 32
32 -
 33
33 -
 34
34 -
 35
35 -
 36
36 -
 37
37 -
 38
38 -
 39
39 -
 40
40 -
 41
41 -
 42
42 -
 43
43 -
 44
44 -
 45
45 -
 46
46 -
 47
47 -
 48
48 -
 49
49 -
 50
50 -
 51
51 -
 52
52 -
53
-
54
-
55
-
56
-
57
-
58
-
59
-
60
-
61
-
62
-
63
-
64
-
65
-
66
-
67
-
68
-
69
-
70
-
71
-
72
-
73
-
74
-
75
-
76
-
77
-
78
-
79
-
80
-
81
-
82
-
83
-
84
-
85
-
86
-
87
-
88
-
89
-
90
-
91
-
92
-
93
-
94
-
95
-
96
-
97
-
98
-
99
-
100
-
101
-
102
-
103
-
104
-
105
-
106
-
107
-
108
 |
 |

Sales
Sales for fiscal 2007 were 7.4% greater than fiscal 2006. Acquisitions contributed 0.7% to the overall sales growth rate
for fiscal 2006. The impact of EITF 04-13 reduced sales growth by 0.7%, or $334,002,000 for fiscal 2007, compared to a
$99,803,000 reduction for fiscal 2006. Sales are reported on a comparable basis beginning in the fourth quarter of fiscal
2007, which is the one-year anniversary of the adoption of EITF 04-13.
Sales for fiscal 2006 were 7.8% greater than fiscal 2005. Acquisitions contributed 1.4% to the overall sales growth rate
for fiscal 2006. The adoption of EITF 04-13 at the beginning of the fourth quarter of fiscal 2006 negatively impacted sales
growth in fiscal 2006 by 0.3%.
Estimated product cost increases were 3.4% during fiscal 2007 as compared to 0.6% during fiscal 2006.
We believe that our continued focus on customer account penetration through the use of business reviews with customers
and the continued investment in increasing the number of customer contact personnel contributed to the sales growth
in fiscal 2007 and 2006. The number of customer contact personnel increased 5% during fiscal 2007 and 6% during fiscal
2006. In addition, we believe fiscal 2006 sales growth was aided by a declining rate of product cost increases experienced
throughout the year, which lessened the overall gross margin pressures and contributed to underlying unit growth.
Industry sources estimate the total foodservice market experienced real sales growth of approximately 1.1% in calendar
year 2006 and 1.7% in calendar year 2005.
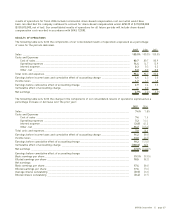
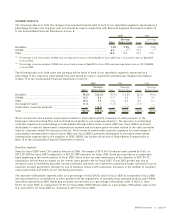
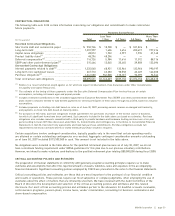
A comparison of the sales mix in the principal product categories during the last three years is presented below:
2007 2006 2005
Fresh and frozen meats ____________________________________________________________________ 19% 19% 19%
Canned and dry products ___________________________________________________________________ 18 18 18
Frozen fruits, vegetables, bakery and other ___________________________________________________ 13 14 14
Poultry ___________________________________________________________________________________ 10 10 11
Dairy products ____________________________________________________________________________ 999
Fresh produce ____________________________________________________________________________ 998
Paper and disposables _____________________________________________________________________ 888
Seafood __________________________________________________________________________________ 555
Beverage products_________________________________________________________________________ 333
Janitorial products ________________________________________________________________________ 322
Equipment and smallwares _________________________________________________________________ 222
Medical supplies __________________________________________________________________________ 111
100% 100% 100%
A comparison of sales by type of customer during the last three years is presented below:
2007 2006 2005
Restaurants ______________________________________________________________________________ 64% 63% 64%
Hospitals and nursing homes _______________________________________________________________ 10 10 10
Schools and colleges_______________________________________________________________________ 555
Hotels and motels _________________________________________________________________________ 666
All other _________________________________________________________________________________ 15 16 15
100% 100% 100%
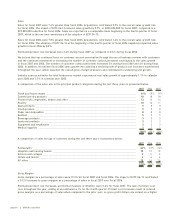
Gross Margins
Gross margins as a percentage of sales were 19.3% for fiscal 2007 and fiscal 2006. The impact of EITF 04-13 contributed
a 0.12% increase to gross margins as a percentage of sales in fiscal 2007 over fiscal 2006.
Estimated product cost increases, an internal measure of inflation, were 3.4% for fiscal 2007. The rate of product cost
rose throughout the year, ending at an estimated 6.1% for the fourth quarter. Product cost increases result in reduced
gross margins as a percentage of sales when compared to the prior year, as gross profit dollars are earned on a higher
page 16 ][ SYSCO Corporation