Sysco 2007 Annual Report Download - page 87
Download and view the complete annual report
Please find page 87 of the 2007 Sysco annual report below. You can navigate through the pages in the report by either clicking on the pages listed below, or by using the keyword search tool below to find specific information within the annual report.-
 1
1 -
2
-
3
-
4
-
5
-
6
-
7
-
8
-
9
-
10
-
11
-
12
-
13
-
14
-
15
-
16
-
17
-
18
-
19
-
20
-
21
-
22
-
23
-
24
-
25
-
26
-
27
-
28
-
29
-
30
-
31
-
32
-
33
-
34
-
35
-
36
-
37
-
38
-
39
-
40
-
41
-
42
-
43
-
44
-
45
-
46
-
47
-
48
-
49
-
50
-
51
-
52
-
53
-
54
-
55
-
56
-
57
-
58
-
59
-
60
-
61
-
62
-
63
-
64
-
65
-
66
-
67
-
68
-
69
-
70
-
71
-
72
-
73
-
74
-
75
-
76
-
 77
77 -
 78
78 -
 79
79 -
 80
80 -
 81
81 -
 82
82 -
 83
83 -
 84
84 -
 85
85 -
 86
86 -
 87
87 -
 88
88 -
 89
89 -
 90
90 -
 91
91 -
 92
92 -
 93
93 -
 94
94 -
 95
95 -
 96
96 -
 97
97 -
98
-
99
-
100
-
101
-
102
-
103
-
104
-
105
-
106
-
107
-
108
 |
 |

based on the timing of when payments related to these items become payable. These reclassifications were $536,492,000
and $497,830,000 in fiscal 2007 and 2006, respectively. Deferred supply chain distributions are classified as current or
deferred tax liabilities based on when the related income tax payments will become payable. The net cash flow impact of
supply chain distribution deferrals in fiscal 2007 was incrementally positive when compared to what would have been paid
on an annual basis without the deferral, due to increased volume through the Baugh Supply Chain Cooperative (BSCC).
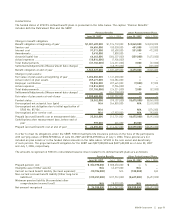
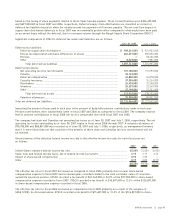
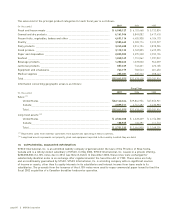
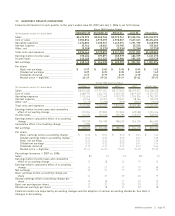
Significant components of SYSCO’s deferred tax assets and liabilities are as follows:
June 30, 2007 July 1, 2006
Deferred tax liabilities:
Deferred supply chain distributions __________________________________________ $ 988,341,000 $ 924,902,000
Excess tax depreciation and basis differences of assets _________________________ 360,271,000 383,636,000
Pension __________________________________________________________________ —58,406,000
Other ____________________________________________________________________ 8,529,000 7,987,000
Total deferred tax liabilities _____________________________________________ 1,357,141,000 1,374,931,000
Deferred tax assets:
Net operating tax loss carryforwards _________________________________________ 101,180,000 112,593,000
Pension __________________________________________________________________ 35,132,000 —
Deferred compensation_____________________________________________________ 49,850,000 45,878,000
Casualty insurance ________________________________________________________ 37,385,000 35,254,000
Receivables _______________________________________________________________ 26,430,000 25,208,000
Inventory _________________________________________________________________ 25,357,000 22,549,000
Other ____________________________________________________________________ 37,198,000 37,251,000
Total deferred tax assets _______________________________________________ 312,532,000 278,733,000
Valuation allowances _______________________________________________________ 70,935,000 80,851,000
Total net deferred tax liabilities _________________________________________________ $1,115,544,000 $1,177,049,000
Impacting the amount of taxes paid in each year is the amount of deductible pension contributions made in each year.
Pension contributions were substantially lower in fiscal 2007 and 2006 as compared to fiscal 2005. The company expects
that its pension contributions in fiscal 2008 will be at a comparable level with fiscal 2007 and 2006.
The company had state and Canadian net operating tax losses as of June 30, 2007 and July 1, 2006, respectively. The net
operating tax losses outstanding as of June 30, 2007 expire in fiscal years 2008 through 2027. A valuation allowance of
$70,935,000 and $80,851,000 was recorded as of June 30, 2007 and July 1, 2006, respectively, as management believes
that it is more likely than not that a portion of the benefits of these state and Canadian tax loss carryforwards will not
be realized.
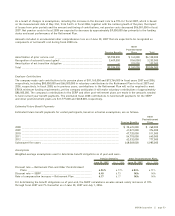
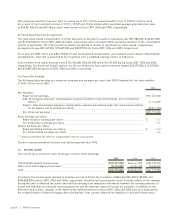
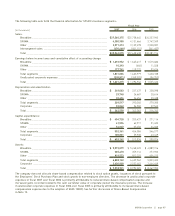
Reconciliations of the statutory federal income tax rate to the effective income tax rates for each fiscal year are
as follows:
2007 2006 2005
United States statutory federal income tax rate ___________________________________________ 35.00% 35.00% 35.00%
State, local and foreign income taxes, net of federal income tax benefit ______________________ 2.15 2.17 2.74
Impact of share-based compensation ____________________________________________________ 0.93 2.09 —
Other _______________________________________________________________________________ 0.17 0.09 (0.77)
38.25% 39.35% 36.97%
The effective tax rate for fiscal 2007 decreased as compared to fiscal 2006 primarily due to lower share-based
compensation expense in fiscal 2007 and increased gains recorded related to the cash surrender value of corporate-
owned life insurance policies. SYSCO recorded a tax benefit of $21,549,000 or 22.0% of the $97,985,000 in share-based
compensation expense recorded in fiscal 2007. SYSCO recorded a tax benefit of $15,607,000 or 12.3% of the $126,837,000
in share-based compensation expense recorded in fiscal 2006.
The effective tax rate for fiscal 2006 increased as compared to fiscal 2005 primarily as a result of the adoption of
SFAS 123(R). As discussed above, SYSCO recorded a tax benefit of $15,607,000 or 12.3% of the $126,837,000 in share-
SYSCO Corporation ][ page 61