Sysco 2007 Annual Report Download - page 91
Download and view the complete annual report
Please find page 91 of the 2007 Sysco annual report below. You can navigate through the pages in the report by either clicking on the pages listed below, or by using the keyword search tool below to find specific information within the annual report.-
 1
1 -
2
-
3
-
4
-
5
-
6
-
7
-
8
-
9
-
10
-
11
-
12
-
13
-
14
-
15
-
16
-
17
-
18
-
19
-
20
-
21
-
22
-
23
-
24
-
25
-
26
-
27
-
28
-
29
-
30
-
31
-
32
-
33
-
34
-
35
-
36
-
37
-
38
-
39
-
40
-
41
-
42
-
43
-
44
-
45
-
46
-
47
-
48
-
49
-
50
-
51
-
52
-
53
-
54
-
55
-
56
-
57
-
58
-
59
-
60
-
61
-
62
-
63
-
64
-
65
-
66
-
67
-
68
-
69
-
70
-
71
-
72
-
73
-
74
-
75
-
76
-
77
-
78
-
79
-
80
-
 81
81 -
 82
82 -
 83
83 -
 84
84 -
 85
85 -
 86
86 -
 87
87 -
 88
88 -
 89
89 -
 90
90 -
 91
91 -
 92
92 -
 93
93 -
 94
94 -
 95
95 -
 96
96 -
 97
97 -
 98
98 -
 99
99 -
 100
100 -
 101
101 -
102
-
103
-
104
-
105
-
106
-
107
-
108
 |
 |

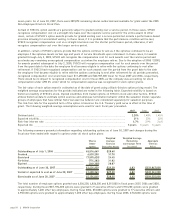
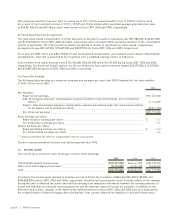
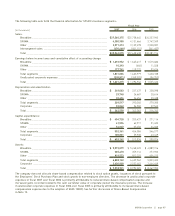
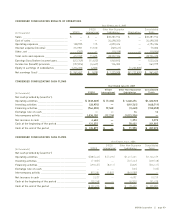
The following table sets forth the financial information for SYSCO’s business segments:
(In thousands) 2007 2006 2005
Fiscal Year
Sales:
Broadline _________________________________________________________ $27,560,375 $25,758,645 $24,337,965
SYGMA ___________________________________________________________ 4,380,955 4,131,666 3,747,349
Other ____________________________________________________________ 3,571,213 3,139,278 2,538,007
Intersegment sales ________________________________________________ (470,468) (401,151) (341,407)
Total _____________________________________________________________ $35,042,075 $32,628,438 $30,281,914
Earnings before income taxes and cumulative effect of accounting change:
Broadline _________________________________________________________ $ 1,692,952 $ 1,545,417 $ 1,515,686
SYGMA ___________________________________________________________ 10,393 (660) 11,028
Other ____________________________________________________________ 127,741 119,222 93,474
Total segments ____________________________________________________ 1,831,086 1,663,979 1,620,188
Unallocated corporate expenses _____________________________________ (209,871) (269,033) (94,752)
Total _____________________________________________________________ $ 1,621,215 $ 1,394,946 $ 1,525,436
Depreciation and amortization:
Broadline _________________________________________________________ $ 249,083 $ 237,437 $ 238,098
SYGMA ___________________________________________________________ 29,740 26,667 20,614
Other ____________________________________________________________ 30,694 26,456 20,488
Total segments ____________________________________________________ 309,517 290,560 279,200
Corporate ________________________________________________________ 53,042 54,502 37,543
Total _____________________________________________________________ $ 362,559 $ 345,062 $ 316,743
Capital expenditures:
Broadline _________________________________________________________ $ 404,728 $ 335,437 $ 271,114
SYGMA ___________________________________________________________ 41,596 62,917 51,403
Other ____________________________________________________________ 56,037 55,650 24,060
Total segments ____________________________________________________ 502,361 454,004 346,577
Corporate ________________________________________________________ 100,881 59,930 43,449
Total _____________________________________________________________ $ 603,242 $ 513,934 $ 390,026
Assets:
Broadline _________________________________________________________ $ 5,573,079 $ 5,248,223 $ 4,889,316
SYGMA ___________________________________________________________ 385,470 359,116 277,922
Other ____________________________________________________________ 929,573 832,223 656,215
Total segments ____________________________________________________ 6,888,122 6,439,562 5,823,453
Corporate ________________________________________________________ 2,630,809 2,552,463 2,444,449
Total _____________________________________________________________ $ 9,518,931 $ 8,992,025 $ 8,267,902
The company does not allocate share-based compensation related to stock option grants, issuances of stock pursuant to
the Employees’ Stock Purchase Plan and stock grants to non-employee directors. The decrease in unallocated corporate
expenses in fiscal 2007 over fiscal 2006 is primarily attributable to reduced share-based compensation expense and
increased gains recorded related to the cash surrender value of corporate-owned life insurance policies. The increase
in unallocated corporate expenses in fiscal 2006 over fiscal 2005 is primarily attributable to increased share-based
compensation expense due to the adoption of SFAS 123(R). See further discussion of Share-Based Compensation
in Note 13.
SYSCO Corporation ][ page 65