Sysco 2007 Annual Report Download - page 95
Download and view the complete annual report
Please find page 95 of the 2007 Sysco annual report below. You can navigate through the pages in the report by either clicking on the pages listed below, or by using the keyword search tool below to find specific information within the annual report.-
 1
1 -
2
-
3
-
4
-
5
-
6
-
7
-
8
-
9
-
10
-
11
-
12
-
13
-
14
-
15
-
16
-
17
-
18
-
19
-
20
-
21
-
22
-
23
-
24
-
25
-
26
-
27
-
28
-
29
-
30
-
31
-
32
-
33
-
34
-
35
-
36
-
37
-
38
-
39
-
40
-
41
-
42
-
43
-
44
-
45
-
46
-
47
-
48
-
49
-
50
-
51
-
52
-
53
-
54
-
55
-
56
-
57
-
58
-
59
-
60
-
61
-
62
-
63
-
64
-
65
-
66
-
67
-
68
-
69
-
70
-
71
-
72
-
73
-
74
-
75
-
76
-
77
-
78
-
79
-
80
-
81
-
82
-
83
-
84
-
 85
85 -
 86
86 -
 87
87 -
 88
88 -
 89
89 -
 90
90 -
 91
91 -
 92
92 -
 93
93 -
 94
94 -
 95
95 -
 96
96 -
 97
97 -
 98
98 -
 99
99 -
 100
100 -
 101
101 -
 102
102 -
 103
103 -
 104
104 -
 105
105 -
106
-
107
-
108
 |
 |

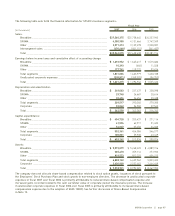
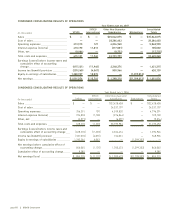
CONDENSED CONSOLIDATING RESULTS OF OPERATIONS
(In thousands) SYSCO
SYSCO
International
Other Non-Guarantor
Subsidiaries Eliminations
Consolidated
Totals
Year Ended July 2, 2005
Sales __________________________________ $ — $ — $30,281,914 $ — $30,281,914
Cost of sales ____________________________ — — 24,498,200 — 24,498,200
Operating expenses ______________________ 100,595 115 4,093,474 — 4,194,184
Interest expense (income) ________________ 312,901 11,510 (249,411) — 75,000
Other, net ______________________________ (747) — (10,159) — (10,906)
Total costs and expenses _________________ 412,749 11,625 28,332,104 — 28,756,478
Earnings (loss) before income taxes________ (412,749) (11,625) 1,949,810 — 1,525,436
Income tax (benefit) provision _____________ (157,876) (4,447) 726,302 — 563,979
Equity in earnings of subsidiaries __________ 1,216,330 6,500 — (1,222,830) —
Net earnings (loss) ______________________ $ 961,457 $ (678) $ 1,223,508 $(1,222,830) $ 961,457
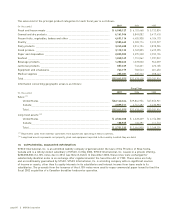
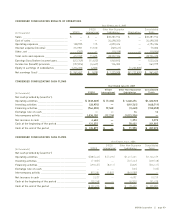
CONDENSED CONSOLIDATING CASH FLOWS
(In thousands) SYSCO
SYSCO
International
Other Non-Guarantor
Subsidiaries
Consolidated
Totals
Year Ended June 30, 2007
Net cash provided by (used for):
Operating activities__________________________________ $ (238,228) $ (7,326) $ 1,648,476 $1,402,922
Investing activities __________________________________ (28,970) — (619,741) (648,711)
Financing activities __________________________________ (764,350) 19,540 (3,440) (748,250)
Exchange rate on cash_______________________________ — — 14 14
Intercompany activity ________________________________ 1,036,150 (12,214) (1,023,936) —
Net increase in cash ________________________________ 4,602 — 1,373 5,975
Cash at the beginning of the period____________________ 131,275 — 70,622 201,897
Cash at the end of the period _________________________ $ 135,877 $ — $ 71,995 $ 207,872
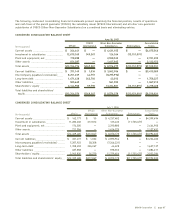
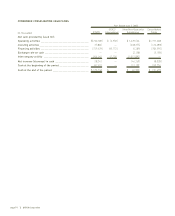
CONDENSED CONSOLIDATING CASH FLOWS
(In thousands) SYSCO
SYSCO
International
Other Non-Guarantor
Subsidiaries
Consolidated
Totals
Year Ended July 1, 2006
Net cash provided by (used for):
Operating activities ____________________________________ $(285,446) $ (7,496) $1,417,621 $1,124,679
Investing activities _____________________________________ (71,851) — (537,667) (609,518)
Financing activities ____________________________________ (490,457) (8,311) (5,849) (504,617)
Exchange rate on cash _________________________________ — — (325) (325)
Intercompany activity __________________________________ 853,281 15,807 (869,088) —
Net increase in cash ___________________________________ 5,527 — 4,692 10,219
Cash at the beginning of the period ______________________ 125,748 — 65,930 191,678
Cash at the end of the period ___________________________ $ 131,275 $ — $ 70,622 $ 201,897
SYSCO Corporation ][ page 69