Sysco 2007 Annual Report Download - page 66
Download and view the complete annual report
Please find page 66 of the 2007 Sysco annual report below. You can navigate through the pages in the report by either clicking on the pages listed below, or by using the keyword search tool below to find specific information within the annual report.-
 1
1 -
2
-
3
-
4
-
5
-
6
-
7
-
8
-
9
-
10
-
11
-
12
-
13
-
14
-
15
-
16
-
17
-
18
-
19
-
20
-
21
-
22
-
23
-
24
-
25
-
26
-
27
-
28
-
29
-
30
-
31
-
32
-
33
-
34
-
35
-
36
-
37
-
38
-
39
-
40
-
41
-
42
-
43
-
44
-
45
-
46
-
47
-
48
-
49
-
50
-
51
-
52
-
53
-
54
-
55
-
 56
56 -
 57
57 -
 58
58 -
 59
59 -
 60
60 -
 61
61 -
 62
62 -
 63
63 -
 64
64 -
 65
65 -
 66
66 -
 67
67 -
 68
68 -
 69
69 -
 70
70 -
 71
71 -
 72
72 -
 73
73 -
 74
74 -
 75
75 -
 76
76 -
77
-
78
-
79
-
80
-
81
-
82
-
83
-
84
-
85
-
86
-
87
-
88
-
89
-
90
-
91
-
92
-
93
-
94
-
95
-
96
-
97
-
98
-
99
-
100
-
101
-
102
-
103
-
104
-
105
-
106
-
107
-
108
 |
 |

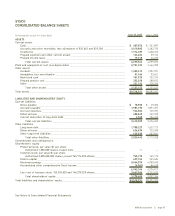
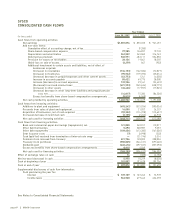
SYSCO
CONSOLIDATED CASH FLOWS
(In thousands) June 30, 2007 July 1, 2006 July 2, 2005
Year Ended
Cash flows from operating activities:
Net earnings ___________________________________________________________ $1,001,076 $ 855,325 $ 961,457
Add non-cash items:
Cumulative effect of accounting change, net of tax_______________________ —(9,285) —
Share-based compensation expense ___________________________________ 97,985 126,837 19,749
Depreciation and amortization ________________________________________ 362,559 345,062 316,743
Deferred tax provision _______________________________________________ 545,971 482,111 554,850
Provision for losses on receivables ____________________________________ 28,156 19,841 18,587
(Gain) loss on sale of assets __________________________________________ (6,279) 847 (952)
Additional investment in certain assets and liabilities, net of effect of
businesses acquired:
(Increase) in receivables _________________________________________ (134,153) (162,586) (72,829)
(Increase) in inventories _________________________________________ (95,932) (119,392) (35,014)
(Increase) decrease in prepaid expenses and other current assets _____ (62,773) 1,741 (4,058)
Increase in accounts payable _____________________________________ 85,422 49,775 28,080
Increase (decrease) in accrued expenses ___________________________ 132,936 29,161 (52,423)
(Decrease) in accrued income taxes _______________________________ (491,993) (545,634) (438,779)
(Increase) in other assets ________________________________________ (36,426) (17,937) (17,865)
(Increase) decrease in other long-term liabilities and prepaid pension
cost, net ___________________________________________________ (14,817) 75,382 (86,338)
Excess tax benefits from share-based compensation arrangements ____ (8,810) (6,569) —
Net cash provided by operating activities ___________________________________ 1,402,922 1,124,679 1,191,208
Cash flows from investing activities:
Additions to plant and equipment _________________________________________ (603,242) (513,934) (390,026)
Proceeds from sales of plant and equipment________________________________ 16,008 21,037 26,257
Acquisition of businesses, net of cash acquired _____________________________ (59,322) (114,378) (115,637)
(Increase) decrease in restricted cash _____________________________________ (2,155) (2,243) 66,918
Net cash used for investing activities ______________________________________ (648,711) (609,518) (412,488)
Cash flows from financing activities:
Bank and commercial paper borrowings (repayments), net ___________________ 121,858 240,017 115,017
Other debt borrowings ___________________________________________________ 5,290 500,987 9,357
Other debt repayments __________________________________________________ (109,656) (413,383) (167,006)
Debt issuance costs _____________________________________________________ (7) (3,998) (320)
Cash (paid for) received from termination of interest rate swap _______________ —(21,196) 5,316
Common stock reissued from treasury _____________________________________ 221,736 128,055 208,004
Treasury stock purchases ________________________________________________ (550,865) (544,131) (597,660)
Dividends paid __________________________________________________________ (445,416) (397,537) (357,298)
Excess tax benefits from share-based compensation arrangements ____________ 8,810 6,569 —
Net cash used for financing activities ______________________________________ (748,250) (504,617) (784,590)
Effect of exchange rates on cash ______________________________________________ 14 (325) (2,158)
Net increase (decrease) in cash _______________________________________________ 5,975 10,219 (8,028)
Cash at beginning of year ____________________________________________________ 201,897 191,678 199,706
Cash at end of year _________________________________________________________ $ 207,872 $ 201,897 $ 191,678
Supplemental disclosures of cash flow information:
Cash paid during the year for:
Interest ____________________________________________________________ $ 107,109 $ 107,242 $ 73,939
Income taxes _______________________________________________________ 563,968 619,442 436,378
See Notes to Consolidated Financial Statements
page 40 ][ SYSCO Corporation