Sysco 2007 Annual Report Download - page 3
Download and view the complete annual report
Please find page 3 of the 2007 Sysco annual report below. You can navigate through the pages in the report by either clicking on the pages listed below, or by using the keyword search tool below to find specific information within the annual report.-
 1
1 -
 2
2 -
 3
3 -
 4
4 -
 5
5 -
 6
6 -
 7
7 -
 8
8 -
 9
9 -
 10
10 -
 11
11 -
 12
12 -
 13
13 -
 14
14 -
15
-
16
-
17
-
18
-
19
-
20
-
21
-
22
-
23
-
24
-
25
-
26
-
27
-
28
-
29
-
30
-
31
-
32
-
33
-
34
-
35
-
36
-
37
-
38
-
39
-
40
-
41
-
42
-
43
-
44
-
45
-
46
-
47
-
48
-
49
-
50
-
51
-
52
-
53
-
54
-
55
-
56
-
57
-
58
-
59
-
60
-
61
-
62
-
63
-
64
-
65
-
66
-
67
-
68
-
69
-
70
-
71
-
72
-
73
-
74
-
75
-
76
-
77
-
78
-
79
-
80
-
81
-
82
-
83
-
84
-
85
-
86
-
87
-
88
-
89
-
90
-
91
-
92
-
93
-
94
-
95
-
96
-
97
-
98
-
99
-
100
-
101
-
102
-
103
-
104
-
105
-
106
-
107
-
108
 |
 |

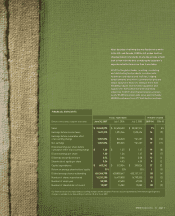
FINANCIAL HIGHLIGHTS
After decades of refining the way foodservice works
in the U.S. and Canada, SYSCO® still prides itself on
shaping industry standards. Every day we take a fresh
look at how to be the best at making the customer’s
experience better tomorrow than it was today.
SYSCO is the global leader in selling, marketing
and distributing food products to restaurants,
healthcare and educational facilities, lodging
establishments and other customers that prepare
meals away from home. Its family of more than
375,000 products also includes equipment and
supplies for the foodservice and hospitality
industries. SYSCO’s distribution network employs
nearly 51,000 associates who serve approximately
400,000 customers from 177 distribution locations.
SYSCO Corporation><page
FISCAL YEAR ENDED PERCENT CHANGE
(Dollars in thousands, except for share data) June 30, 2007 July 1, 2006 July 2, 2005 2007-06 2006-05
Sales $ 35,042,075 $ 32,628,438 $ 30,281,914 7% 8%
Earnings before income taxes 1,621,215 1,394,946 1,525,436 16 (9)
Earnings before cumulative effect
of accounting change 1,001,076 846,040 961,457 18 (12)
Net earnings 1,001,076 855,325 961,457 17 (11)
Diluted earnings per share before
cumulative effect of accounting change $ 1.60 $ 1.35 $ 1.47 19 (8)
Diluted earnings per share 1.60 1.36 1.47 18 (7)
Dividends declared per share 0.74 0.66 0.58 12 14
Shareholders’ equity per share 5.36 4.93 4.39 9 12
Capital expenditures $ 603,242 $ 513,934 $ 390,026 17 32
Return on average shareholders’ equity 31% 30% 35% 1 (5)
Diluted average shares outstanding 626,366,798 628,800,647 653,157,117 (0) (4)
Number of shares repurchased 16,231,200 16,479,800 16,790,200 (2) (2)
Number of employees 50,900 49,600 47,500 3 4
Number of shareholders of record 13,557 14,282 15,083 (5) (5)
Our financial results are impacted by accounting changes and the adoption of various accounting standards. Information regarding these
changes is available in our Annual Report on Form 10-K for fiscal 2007.