Sysco 2014 Annual Report Download - page 100
Download and view the complete annual report
Please find page 100 of the 2014 Sysco annual report below. You can navigate through the pages in the report by either clicking on the pages listed below, or by using the keyword search tool below to find specific information within the annual report.-
 1
1 -
2
-
3
-
4
-
5
-
6
-
7
-
8
-
9
-
10
-
11
-
12
-
13
-
14
-
15
-
16
-
17
-
18
-
19
-
20
-
21
-
22
-
23
-
24
-
25
-
26
-
27
-
28
-
29
-
30
-
31
-
32
-
33
-
34
-
35
-
36
-
37
-
38
-
39
-
40
-
41
-
42
-
43
-
44
-
45
-
46
-
47
-
48
-
49
-
50
-
51
-
52
-
53
-
54
-
55
-
56
-
57
-
58
-
59
-
60
-
61
-
62
-
63
-
64
-
65
-
66
-
67
-
68
-
69
-
70
-
71
-
72
-
73
-
74
-
75
-
76
-
77
-
78
-
79
-
80
-
81
-
82
-
83
-
84
-
85
-
86
-
87
-
88
-
89
-
 90
90 -
 91
91 -
 92
92 -
 93
93 -
 94
94 -
 95
95 -
 96
96 -
 97
97 -
 98
98 -
 99
99 -
 100
100 -
 101
101 -
 102
102 -
 103
103 -
 104
104 -
 105
105 -
 106
106 -
 107
107 -
 108
108
 |
 |

SYSCO CORPORATION-Form10-K88
PARTII
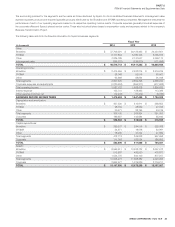
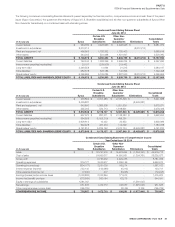
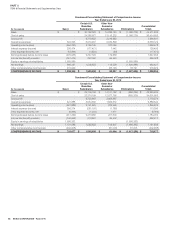
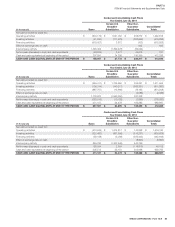
ITEM8Financial Statements and Supplementary Data
(Inthousands)
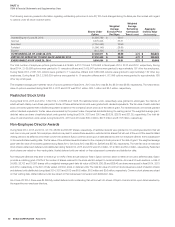
Condensed Consolidating Statement of Comprehensive Income
Year Ended June 29, 2013
Sysco
Certain U.S.
Broadline
Subsidiaries
Other Non-
Guarantor
Subsidiaries Eliminations
Consolidated
Totals
Sales $ - $ 30,162,329 $ 15,335,180 $ (1,086,276) $ 44,411,233
Cost of sales - 24,385,677 13,115,225 (1,086,276) 36,414,626
Gross pro t - 5,776,652 2,219,955 - 7,996,607
Operating expenses 694,323 3,610,907 2,032,899 - 6,338,129
Operating income (loss) (694,323) 2,165,745 187,056 - 1,658,478
Interest expense (income) 298,474 (177,421) 7,442 - 128,495
Other expense (income), net (12,864) (4,554) (54) - (17,472)
Earnings (losses) before income taxes (979,933) 2,347,720 179,668 - 1,547,455
Income tax (bene t) provision (351,474) 842,062 64,440 - 555,028
Equity in earnings of subsidiaries 1,620,886 - - (1,620,886) -
Net earnings 992,427 1,505,658 115,228 (1,620,886) 992,427
Other comprehensive income (loss) 215,929 - (33,191) 33,191 215,929
COMPREHENSIVE INCOME $ 1,208,356 $ 1,505,658 $ 82,037 $ (1,587,695) $ 1,208,356
(Inthousands)
Condensed Consolidating Statement of Comprehensive Income
Year Ended June 30, 2012
Sysco
Certain U.S.
Broadline
Subsidiaries
Other Non-
Guarantor
Subsidiaries Eliminations
Consolidated
Totals
Sales $ - $ 29,100,106 $ 14,131,162 $ (850,329) $ 42,380,939
Cost of sales - 23,374,199 12,077,795 (850,329) 34,601,665
Gross pro t - 5,725,907 2,053,367 - 7,779,274
Operating expenses 527,888 3,534,382 1,826,372 - 5,888,642
Operating income (loss) (527,888) 2,191,525 226,995 - 1,890,632
Interest expense (income) 396,374 (281,193) (1,785) - 113,396
Other expense (income), net (6,993) (1,244) 1,471 - (6,766)
Earnings (losses) before income taxes (917,269) 2,473,962 227,309 - 1,784,002
Income tax (bene t) provision (340,592) 918,607 84,402 - 662,417
Equity in earnings of subsidiaries 1,698,262 - - (1,698,262) -
Net earnings 1,121,585 1,555,355 142,907 (1,698,262) 1,121,585
Other comprehensive income (loss) (402,908) - (81,003) 81,003 (402,908)
COMPREHENSIVE INCOME $ 718,677 $ 1,555,355 $ 61,904 $ (1,617,259) $ 718,677