Sysco 2014 Annual Report Download - page 37
Download and view the complete annual report
Please find page 37 of the 2014 Sysco annual report below. You can navigate through the pages in the report by either clicking on the pages listed below, or by using the keyword search tool below to find specific information within the annual report.-
 1
1 -
2
-
3
-
4
-
5
-
6
-
7
-
8
-
9
-
10
-
11
-
12
-
13
-
14
-
15
-
16
-
17
-
18
-
19
-
20
-
21
-
22
-
23
-
24
-
25
-
26
-
 27
27 -
 28
28 -
 29
29 -
 30
30 -
 31
31 -
 32
32 -
 33
33 -
 34
34 -
 35
35 -
 36
36 -
 37
37 -
 38
38 -
 39
39 -
 40
40 -
 41
41 -
 42
42 -
 43
43 -
 44
44 -
 45
45 -
 46
46 -
 47
47 -
48
-
49
-
50
-
51
-
52
-
53
-
54
-
55
-
56
-
57
-
58
-
59
-
60
-
61
-
62
-
63
-
64
-
65
-
66
-
67
-
68
-
69
-
70
-
71
-
72
-
73
-
74
-
75
-
76
-
77
-
78
-
79
-
80
-
81
-
82
-
83
-
84
-
85
-
86
-
87
-
88
-
89
-
90
-
91
-
92
-
93
-
94
-
95
-
96
-
97
-
98
-
99
-
100
-
101
-
102
-
103
-
104
-
105
-
106
-
107
-
108
 |
 |

SYSCO CORPORATION-Form10-K 25
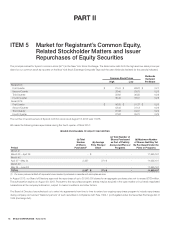
PARTII
ITEM7Management’s Discussion and Analysis ofFinancial Condition and Results of Operations
Cost per case is an important metric management uses to measure our expense performance. This metric is calculated by taking the total operating
expense of our North American Broadline companies, divided by the number of cases sold. Adjusted cost per case is calculated similarly, however the
operating expense component excludes charges from executive retirement plans restructuring, multiemployer pension plans and severance, which are
the Certain Items applicable to these companies, divided by the number of cases sold. Our corporate expenses are not included in the cost per cases
metrics because the metric is a measure of ef ciency in our operations. We seek to grow our sales and either minimize or reduce our costs on a per
case basis. Our cost per case was a decrease of $0.10 per case in scal 2014 as compared to scal 2013. Our adjusted cost per case calculated on a
non-GAAP basis decreased $0.06 in scal 2014 as compared to scal 2013, primarily from reduced pay-related expenses from our sales and information
technology areas and lower retirement-related expenses, partially offset by increased costs from delivery pay-related expenses. We expect our cost per
case in scal 2015 to be similar to scal 2014. More information on the rationale for the use of these measures and reconciliations can be found under
“Non-GAAP Reconciliations.”
Certain Items Within Operating Expenses
Sysco’s results of operating expenses are impacted by Certain Items which are expenses that can be dif cult to predict and can be unanticipated. More
information on the rationale for the use of these measures and reconciliations to GAAP numbers can be found under “Non-GAAP Reconciliations.” Our
signi cant Certain Items applicable for scal 2014 included costs in connection with the proposed merger with US Foods, a change in the estimate of our
self insurance reserve and a liability for a settlement. Our signi cant Certain Items applicable for scal 2013 related to withdrawal liabilities from multiemployer
pension plans, severance charges and costs from restructuring executive retirement plans. Costs from restructuring executive retirement plans are discussed
below under Fiscal 2013 vs. Fiscal 2012.
We have incurred additional costs in connection with the proposed merger with US Foods announced in the second quarter of scal 2014 primarily from
integration planning and due diligence costs. These costs totaled $90.6 million in scal 2014. We anticipate incurring additional costs as we continue
planning for integration of the two companies as well as other nancing costs incurred in connection with the proposed merger.
From time to time, we may voluntarily withdraw from multiemployer pension plans to minimize or limit our future exposure to these plans. In scal 2014 and
scal 2013, we recorded provisions of $1.5 million and $41.9 million, respectively, related to multiemployer pension plan withdrawals.
Sysco maintains a self-insurance program covering portions of workers’ compensation, general and vehicle liability and property insurance costs. The
amounts in excess of the self-insured levels are fully insured by third party insurers. Liabilities associated with these risks are estimated in part by considering
historical claims experience, medical cost trends, demographic factors, severity factors and other actuarial assumptions. In the second quarter of scal
2014, based on the historical trends of increased costs primarily attributable to our worker’s compensation claims, we increased our estimates of our
self-insurance reserve to a higher point in an estimated range of liability as opposed to our past position at the lower end of the range. This resulted in a
charge of $23.8 million in scal 2014.
During the rst quarter of scal 2014, Sysco was made aware of certain alleged violations of California law relating to its use of remote storage units in the
delivery of products. These are commonly referred to as drop sites. As of June 28, 2014, we have recorded a liability for a settlement of $20 million. In July
2014, Sysco agreed to a $19.4 million settlement, which includes a payment of $15.0 million in penalties, $3.3 million to fund four California Department
of Public Health investigator positions for ve years, a $1.0 million donation to food banks across California, and $0.1 million in legal fees. The cash portion
of the settlement was paid in August 2014 and the donations to the food banks will occur in scal 2015. In the rst quarter of scal 2014, we eliminated
the use of drop sites across Sysco. During scal 2014, we introduced mandatory, annual food safety training for all employees across Sysco. We are
implementing additional and improved food safety reporting, monitoring and compliance controls across our operations to ensure adherence to our policies.
Fiscal 2013 vs. Fiscal 2012
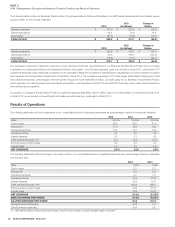
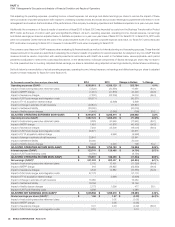
The following table sets forth the change in the components of operating income and adjusted operating income expressed as a percentage increase or
decrease over the prior year:
(Dollars Inthousands)
2013 2012 Change in Dollars % Change
Gross pro t $ 7,996,607 $ 7,779,274 $ 217,333 2.8%
Operating expenses 6,338,129 5,888,642 449,487 7.6
OPERATING INCOME $ 1,658,478 $ 1,890,632 $ (232,154) (12.3 )%
Gross pro t $ 7,996,607 $ 7,779,274 $ 217,333 2.8%
Adjusted operating expenses (Non-GAAP) 5,912,870 5,659,165 253,705 4.5
ADJUSTED OPERATING INCOME (NON-GAAP) $ 2,083,737 $ 2,120,109 $ (36,372) (1.7)%