Sysco 2014 Annual Report Download - page 39
Download and view the complete annual report
Please find page 39 of the 2014 Sysco annual report below. You can navigate through the pages in the report by either clicking on the pages listed below, or by using the keyword search tool below to find specific information within the annual report.-
 1
1 -
2
-
3
-
4
-
5
-
6
-
7
-
8
-
9
-
10
-
11
-
12
-
13
-
14
-
15
-
16
-
17
-
18
-
19
-
20
-
21
-
22
-
23
-
24
-
25
-
26
-
27
-
28
-
 29
29 -
 30
30 -
 31
31 -
 32
32 -
 33
33 -
 34
34 -
 35
35 -
 36
36 -
 37
37 -
 38
38 -
 39
39 -
 40
40 -
 41
41 -
 42
42 -
 43
43 -
 44
44 -
 45
45 -
 46
46 -
 47
47 -
 48
48 -
 49
49 -
50
-
51
-
52
-
53
-
54
-
55
-
56
-
57
-
58
-
59
-
60
-
61
-
62
-
63
-
64
-
65
-
66
-
67
-
68
-
69
-
70
-
71
-
72
-
73
-
74
-
75
-
76
-
77
-
78
-
79
-
80
-
81
-
82
-
83
-
84
-
85
-
86
-
87
-
88
-
89
-
90
-
91
-
92
-
93
-
94
-
95
-
96
-
97
-
98
-
99
-
100
-
101
-
102
-
103
-
104
-
105
-
106
-
107
-
108
 |
 |
SYSCO CORPORATION-Form10-K 27
PARTII
ITEM7Management’s Discussion and Analysis ofFinancial Condition and Results of Operations
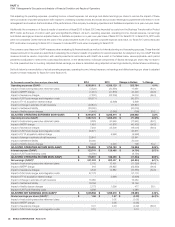
Certain Items Within Operating Expenses
Our results of operating expenses are impacted by Certain Items which are expenses that can be non-recurring or not a part of our everyday operations.
See more information on the rationale of the use of these measures and reconciliations to GAAP numbers can be found under “Non-GAAP Reconciliations.”
Expenses related to our Business Transformation Project, inclusive of pay-related and software amortization expense, were $330.5 million in scal 2013 and
$193.1 million in scal 2012, representing an increase of $137.4 million. The increase in scal 2013 resulted in part from the initiation of software amortization
as the system was placed into service in August 2012. The increase in depreciation and amortization expense related to the Business Transformation
Project was $59.6 million in scal 2013 over scal 2012. Our project was not in the deployment stage during any period of scal 2012; therefore, a greater
portion of the costs were capitalized in scal 2012.
As a result of executive retirement plan restructuring discussed above, we incurred $21.0 million in charges in scal 2013. These charges are in addition
to the recurring retirement-related expenses discussed above.
From time to time, we may voluntarily withdraw from multiemployer pension plans to minimize or limit our future exposure to these plans. In scal 2013 and
scal 2012, we recorded provisions of $41.9 million and $21.9 million, respectively, related to multiemployer pension plan withdrawals.
Net Earnings
Net earnings decreased 6.1% in scal 2014 from scal 2013 due primarily to the changes in operating income discussed above. Adjusted net earnings
decreased 1.8% during scal 2014.
Net earnings for scal 2013 decreased 11.5% over scal 2012. This decrease was primarily due to changes in operating income discussed above. Adjusted
net earnings increased 0.1% during scal 2013.
The effective tax rate of 36.87% for scal 2014 was negatively impacted primarily by two items. First, we recorded tax expense of $6.2 million related to
a non-deductible penalty that the company incurred. Second, we recorded net tax expense of $5.2 million for tax and interest related to various federal,
foreign and state uncertain tax positions. This negative impact was partially offset by the recording of $5.7 million of tax bene t related to disqualifying
dispositions of Sysco stock pursuant to share-based compensation arrangements. Inde nitely reinvested earnings taxed at foreign statutory rates less
than our domestic tax rate also had the impact of reducing the effective tax rate.
The effective tax rate of 35.87% for scal 2013 was favorably impacted primarily by two items. First, we recorded a tax bene t of $14.0 million related to
changes in estimates for the prior year domestic tax provision. Second, we recorded a tax bene t of $8.8 million related to disqualifying dispositions of
Sysco stock pursuant to share-based compensation arrangements. The effective tax rate was negatively impacted by the recording of $5.7 million in tax
and interest related to various federal, foreign and state uncertain tax positions. Inde nitely reinvested earnings taxed at foreign statutory rates less than
our domestic tax rate also had the impact of reducing the effective tax rate.
The effective tax rate for scal 2012 was 37.13%. Inde nitely reinvested earnings taxed at foreign statutory tax rates less than our domestic tax rate had
the impact of reducing the effective tax rate.
Earnings Per Share
Basic earnings per share in scal 2014 was $1.59, a 5.4% decrease from the scal 2013 amount of $1.68 per share. Diluted earnings per share in scal
2014 was $1.58, a 5.4% decrease from the scal 2013 amount of $1.67 per share. This decrease was primarily the result of the factors discussed above.
Adjusted diluted earnings per share in scal 2014 was $1.76, a decrease of 1.1% from the comparable prior year period amount of $1.78.
Basic earnings per share in scal 2013 was $1.68, a 12.0% decrease from the comparable prior year period amount of $1.91 per share. Diluted earnings
per share in scal 2013 was $1.67, a 12.1% decrease from the comparable prior year period amount of $1.90 per share. This decrease was primarily the
result of the factors discussed above. Adjusted diluted earnings per share in scal 2013 was $2.14, a decrease of 0.5% from the comparable prior year
period amount of $2.15.
All earnings per share metrics for scal 2013 were partially impacted from greater shares outstanding. Sysco experienced a greater number of stock option
exercises in scal 2013 as compared to scal 2012, which increased the number of shares outstanding.
Non-GAAP Reconciliations and Adjusted Cost per Case
Sysco’s results of operations are impacted by costs from executive retirement plans restructuring charges, multiemployer pension (MEPP) charges, severance
charges, merger and integration costs associated with our pending US Foods merger, a scal 2013 acquisition related charge, change in estimate for
self-insurance costs, charges from a liability for a settlement, facility closure charges and amortization of US Foods nancing costs. Management believes