Sysco 2014 Annual Report Download - page 97
Download and view the complete annual report
Please find page 97 of the 2014 Sysco annual report below. You can navigate through the pages in the report by either clicking on the pages listed below, or by using the keyword search tool below to find specific information within the annual report.-
 1
1 -
2
-
3
-
4
-
5
-
6
-
7
-
8
-
9
-
10
-
11
-
12
-
13
-
14
-
15
-
16
-
17
-
18
-
19
-
20
-
21
-
22
-
23
-
24
-
25
-
26
-
27
-
28
-
29
-
30
-
31
-
32
-
33
-
34
-
35
-
36
-
37
-
38
-
39
-
40
-
41
-
42
-
43
-
44
-
45
-
46
-
47
-
48
-
49
-
50
-
51
-
52
-
53
-
54
-
55
-
56
-
57
-
58
-
59
-
60
-
61
-
62
-
63
-
64
-
65
-
66
-
67
-
68
-
69
-
70
-
71
-
72
-
73
-
74
-
75
-
76
-
77
-
78
-
79
-
80
-
81
-
82
-
83
-
84
-
85
-
86
-
 87
87 -
 88
88 -
 89
89 -
 90
90 -
 91
91 -
 92
92 -
 93
93 -
 94
94 -
 95
95 -
 96
96 -
 97
97 -
 98
98 -
 99
99 -
 100
100 -
 101
101 -
 102
102 -
 103
103 -
 104
104 -
 105
105 -
 106
106 -
 107
107 -
108
 |
 |
SYSCO CORPORATION-Form10-K 85
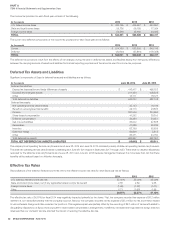
PARTII
ITEM8Financial Statements and Supplementary Data
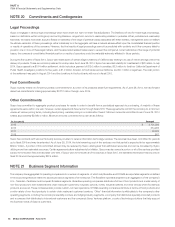
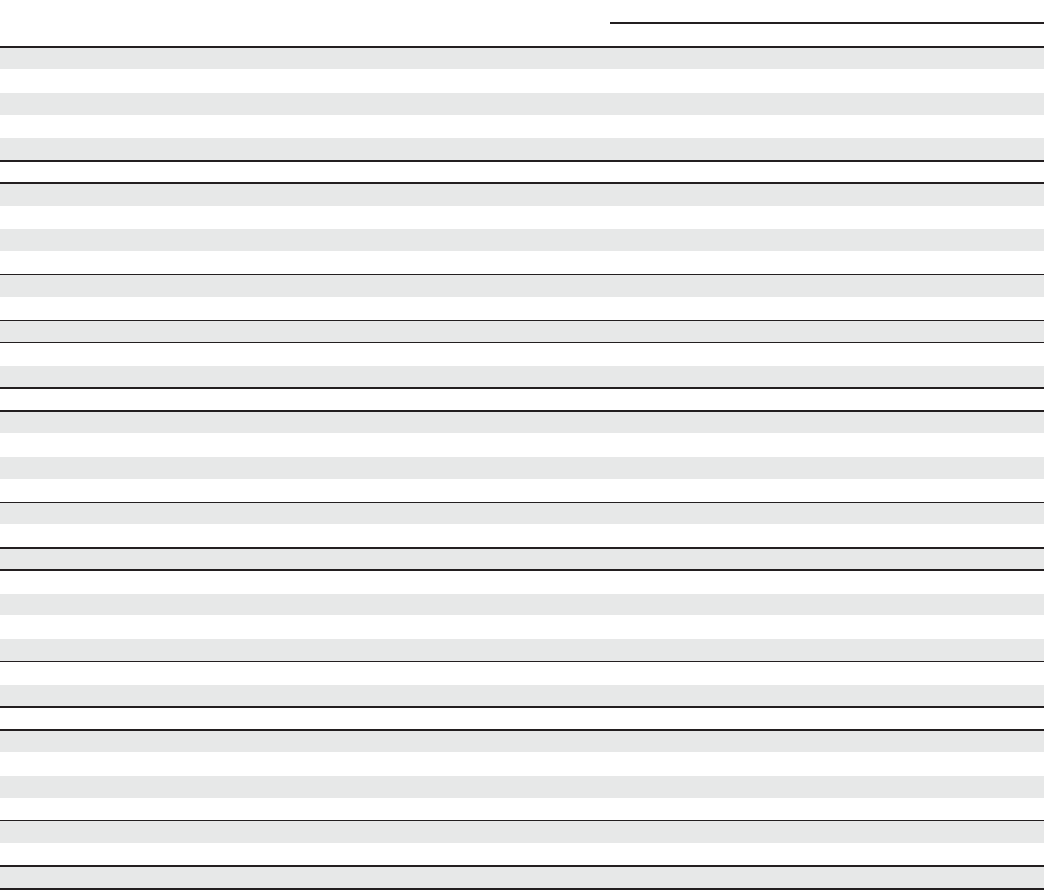
The accounting policies for the segments are the same as those disclosed by Sysco for its consolidated nancial statements. Intersegment sales
represent specialty produce and imported specialty products distributed by the Broadline and SYGMA operating companies. Management evaluates the
performance of each of our operating segments based on its respective operating income results. Corporate expenses generally include all expenses of
the corporate of ce and Sysco’s shared service center. These also include all share-based compensation costs and expenses related to the company’s
Business Transformation Project.
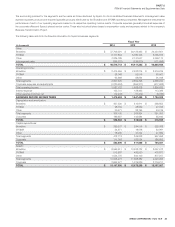
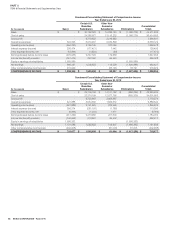
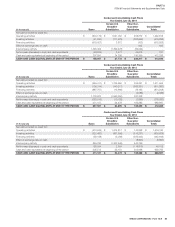
The following table sets forth the nancial information for Sysco’s business segments:
(Inthousands)
Fiscal Year
2014 2013 2012
Sales:
Broadline $ 37,709,391 $ 36,129,463 $ 34,420,851
SYGMA 6,177,804 5,780,103 5,735,673
Other 2,925,789 2,741,537 2,396,113
Intersegment sales (296,272) (239,870) (171,698)
TOTAL $ 46,516,712 $ 44,411,233 $ 42,380,939
Operating income:
Broadline $ 2,475,659 $ 2,402,215 $ 2,416,225
SYGMA 38,048 52,016 60,967
Other 93,668 98,564 91,048
Total segments 2,607,375 2,552,795 2,568,240
Corporate expenses and adjustments (1,020,253) (894,317) (677,608)
Total operating income 1,587,122 1,658,478 1,890,632
Interest expense 123,741 128,495 113,396
Other expense (income), net (12,243) (17,472) (6,766)
EARNINGS BEFORE INCOME TAXES $ 1,475,624 $ 1,547,455 $ 1,784,002
Depreciation and amortization:
Broadline $ 307,500 $ 313,611 $ 298,852
SYGMA 28,164 28,059 27,706
Other 30,471 28,194 24,745
Total segments 366,135 369,864 351,303
Corporate 189,927 142,684 65,640
TOTAL $ 556,062 $ 512,548 $ 416,943
Capital expenditures:
Broadline $ 299,207 $ 284,016 $ 525,368
SYGMA 34,671 18,078 30,961
Other 78,235 47,744 41,669
Total segments 412,113 349,838 597,998
Corporate 111,093 162,024 186,503
TOTAL $ 523,206 $ 511,862 $ 784,501
Assets:
Broadline $ 8,956,911 $ 10,228,722 $ 8,067,912
SYGMA 513,587 485,520 475,877
Other 1,034,775 944,140 877,207
Total segments 10,505,273 11,658,382 9,420,996
Corporate 2,662,677 1,019,826 2,716,211
TOTAL $ 13,167,950 $ 12,678,208 $ 12,137,207