Sysco 2014 Annual Report Download - page 42
Download and view the complete annual report
Please find page 42 of the 2014 Sysco annual report below. You can navigate through the pages in the report by either clicking on the pages listed below, or by using the keyword search tool below to find specific information within the annual report.-
 1
1 -
2
-
3
-
4
-
5
-
6
-
7
-
8
-
9
-
10
-
11
-
12
-
13
-
14
-
15
-
16
-
17
-
18
-
19
-
20
-
21
-
22
-
23
-
24
-
25
-
26
-
27
-
28
-
29
-
30
-
31
-
 32
32 -
 33
33 -
 34
34 -
 35
35 -
 36
36 -
 37
37 -
 38
38 -
 39
39 -
 40
40 -
 41
41 -
 42
42 -
 43
43 -
 44
44 -
 45
45 -
 46
46 -
 47
47 -
 48
48 -
 49
49 -
 50
50 -
 51
51 -
 52
52 -
53
-
54
-
55
-
56
-
57
-
58
-
59
-
60
-
61
-
62
-
63
-
64
-
65
-
66
-
67
-
68
-
69
-
70
-
71
-
72
-
73
-
74
-
75
-
76
-
77
-
78
-
79
-
80
-
81
-
82
-
83
-
84
-
85
-
86
-
87
-
88
-
89
-
90
-
91
-
92
-
93
-
94
-
95
-
96
-
97
-
98
-
99
-
100
-
101
-
102
-
103
-
104
-
105
-
106
-
107
-
108
 |
 |

SYSCO CORPORATION-Form10-K30
PARTII
ITEM7Management’s Discussion and Analysis ofFinancial Condition and Results of Operations
Fiscal 2014 change from
Fiscal 2013
Fiscal 2013 change from
Fiscal 2012
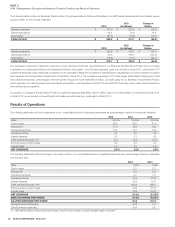
(Decrease) Increase in cost per case $ (0.10) $ 0.03
Impact of Certain Items (1) 0.04 (0.04)
(DECREASE) IN ADJUSTED COST PER CASE (NON-GAAP BASIS) $ (0.06) $ (0.01)
(1) For all periods, the impact of Certain Items excludes charges from executive retirement plans restructuring, multiemployer pension plans and severance. For the fiscal 2014 comparison to fiscal
2013, the majority relates to multiemployer pension plans in the amount of $0.04 per case attributable to charges taken in fiscal 2013 that did not recur at the same magnitude in fiscal 2014.
For the fiscal 2013 comparison to fiscal 2012, the majority relates to multiemployer pension plans in the amount of $0.03 per case attributable to charges taken in fiscal 2013 that did not recur
at the same magnitude in fiscal 2012, and the remainder relates to severance charges.
Segment Results
We have aggregated our operating companies into a number of segments, of which only Broadline and SYGMA are reportable segments as de ned in
accounting provisions related to disclosures about segments of an enterprise. The accounting policies for the segments are the same as those disclosed
by Sysco within the Financial Statements and Supplementary Data within Part II Item 8 of this Form 10-K. Intersegment sales represent specialty produce
and imported specialty products distributed by the Broadline and SYGMA operating companies.
Management evaluates the performance of each of our operating segments based on its respective operating income results. Corporate expenses and
adjustments generally include all expenses of the corporate of ce and Sysco’s shared service center. These also include all share-based compensation
costs and expenses related to the company’s Business Transformation Project. While a segment’s operating income may be impacted in the short-term by
increases or decreases in gross pro ts, expenses, or a combination thereof, over the long-term each business segment is expected to increase its operating
income at a greater rate than sales growth. This is consistent with our long-term goal of leveraging earnings growth at a greater rate than sales growth.
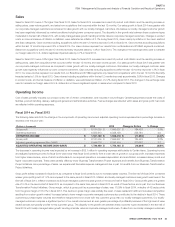
The following table sets forth the operating income of each of our reportable segments and the other segment expressed as a percentage of each
segment’s sales for each period reported and should be read in conjunction with Note 21, “Business Segment Information” to the Consolidated Financial
Statements in Item 8:
Operating Income as a Percentage of Sales
2014 2013 2012
Broadline 6.6% 6.6% 7.0%
SYGMA 0.6 0.9 1.1
Other 3.2 3.6 3.8
The following table sets forth the change in the selected nancial data of each of our reportable segments and the other segment expressed as a percentage
increase over the prior year and should be read in conjunction with Note 21, “Business Segment Information” to the Consolidated Financial Statements
in Item 8:
2014 2013
Sales
Operating
Income Sales
Operating
Income
Broadline 4.4% 3.1% 5.0% (0.6)%
SYGMA 6.9 (26.9)(1) 0.8 (14.7)(1)
Other 6.7 (5.0) 14.4 8.3
(1) SYGMA had operating income of $38.0 million in fiscal 2014, $52.0 million in fiscal 2013 and $61.0 million in fiscal 2012.
The following table sets forth sales and operating income of each of our reportable segments, the other segment, and intersegment sales, expressed as a
percentage of aggregate segment sales, including intersegment sales, and operating income, respectively. For purposes of this statistical table, operating
income of our segments excludes corporate expenses and adjustments of $1,020.3 million in scal 2014, $894.3 million in scal 2013 and $677.6 million
in scal 2012 that are not charged to our segments. This information should be read in conjunction with Note 21, “Business Segment Information” to the
Consolidated Financial Statements in Item 8:
2014 2013 2012
Sales
Segment
Operating
Income Sales
Segment
Operating
Income Sales
Segment
Operating
Income
Broadline 81.0% 94.9% 81.3% 94.1% 81.2% 94.1%
SYGMA 13.3 1.5 13.0 2.0 13.5 2.4
Other 6.3 3.6 6.2 3.9 5.7 3.5
Intersegment sales (0.6) - (0.5) - (0.4) -
TOTAL 100.0% 100.0% 100.0% 100.0% 100.0% 100.0%