Sysco 2014 Annual Report Download - page 46
Download and view the complete annual report
Please find page 46 of the 2014 Sysco annual report below. You can navigate through the pages in the report by either clicking on the pages listed below, or by using the keyword search tool below to find specific information within the annual report.-
 1
1 -
2
-
3
-
4
-
5
-
6
-
7
-
8
-
9
-
10
-
11
-
12
-
13
-
14
-
15
-
16
-
17
-
18
-
19
-
20
-
21
-
22
-
23
-
24
-
25
-
26
-
27
-
28
-
29
-
30
-
31
-
32
-
33
-
34
-
35
-
 36
36 -
 37
37 -
 38
38 -
 39
39 -
 40
40 -
 41
41 -
 42
42 -
 43
43 -
 44
44 -
 45
45 -
 46
46 -
 47
47 -
 48
48 -
 49
49 -
 50
50 -
 51
51 -
 52
52 -
 53
53 -
 54
54 -
 55
55 -
 56
56 -
57
-
58
-
59
-
60
-
61
-
62
-
63
-
64
-
65
-
66
-
67
-
68
-
69
-
70
-
71
-
72
-
73
-
74
-
75
-
76
-
77
-
78
-
79
-
80
-
81
-
82
-
83
-
84
-
85
-
86
-
87
-
88
-
89
-
90
-
91
-
92
-
93
-
94
-
95
-
96
-
97
-
98
-
99
-
100
-
101
-
102
-
103
-
104
-
105
-
106
-
107
-
108
 |
 |
SYSCO CORPORATION-Form10-K34
PARTII
ITEM7Management’s Discussion and Analysis ofFinancial Condition and Results of Operations
•acquisitions compatible with our overall growth strategy;
•contributions to our various retirement plans; and
•debt repayments.
Any remaining cash generated from operations may be invested in high-quality, short-term instruments. As a part of our ongoing strategic analysis, we
regularly evaluate business opportunities, including potential acquisitions and sales of assets and businesses, and our overall capital structure. Any
transactions resulting from these evaluations may materially impact our liquidity, borrowing capacity, leverage ratios and capital availability.
In the second quarter of scal 2014, we announced an agreement to merge with US Foods. As of the time the merger agreement was announced
in December 2013, Sysco agreed to pay approximately $3.5 billion for the equity of US Foods, comprised of $3 billion of Sysco common stock and
$500million of cash. As part of the transaction, Sysco will also assume or re nance US Foods’ net debt, which was approximately $4.7 billion as of
September 28, 2013, bringing the total enterprise value to $8.2 billion at the time of the merger announcement. As of August 13, 2014, the merger
consideration is estimated as follows: approximately $3.7 billion for the equity of US Foods, comprised of $3.2 billion of Sysco common stock valued
using the seven day average through August 13, 2014 and $500 million of cash. US Foods’ net debt to be assumed or re nanced was approximately
$4.8 billion as of June 28, 2014, bringing the total enterprise value to $8.5 billion as of August 13, 2014. The value of Sysco’s common stock and the
amount of US Foods’ net debt will uctuate. As such, the components of the transaction and total enterprise value noted above will not be nalized
until the merger is consummated. We have secured a fully committed bridge nancing and expect to issue longer-term nancing prior to closing. After
completion of the transaction, the equity holders of US Foods will own approximately 87 million shares, or roughly 13%, of Sysco. This merger iscurrently
pending a regulatory review process by the Federal Trade Commission and we estimate the merger will close by the end of the third quarter or in the
fourth quarter of calendar 2014. Under certain conditions, including lack of regulatory approval, Sysco would be obligated to pay $300 million to the
owners of US Foods if the merger were cancelled.
We continue to generate substantial cash ows from operations and remain in a strong nancial position, however our liquidity and capital resources
can be in uenced by economic trends and conditions that impact our results of operations. Uncertain economic conditions and uneven levels of
consumer con dence and the resulting pressure on consumer disposable income have lowered our sales growth and impacted our cash ows
from operations. Competitive pressures in a low growth environment have also lowered our gross margins which in turn can cause our cash ows
from operations to decrease. We believe our mechanisms to manage working capital, such as credit monitoring, optimizing inventory levels and
maximizing payment terms with vendors, and our mechanisms to manage the items impacting our gross pro ts have been suf cient to limit a signi cant
unfavorable impact on our cash ows from operations. We believe these mechanisms will continue to prevent a signi cant unfavorable impact on our
cash ows from operations. As of June 28, 2014, we had $413.0 million in cash and cash equivalents, approximately 32% of which was held by our
international subsidiaries generated from our earnings of international operations. If these earnings were transferred among countries or repatriated
to the U.S., such amounts may be subject to additional tax obligations; however, we do not currently anticipate the need to relocate this cash.
We believe the following sources will be suf cient to meet our anticipated cash requirements for the next twelve months, while maintaining suf cient liquidity
for normal operating purposes:
•our cash ows from operations;
•the availability of additional capital under our existing commercial paper programs, supported by our revolving credit facility, and bank lines of credit;
•our ability to access capital from nancial markets, including issuances of debt securities, either privately or under our shelf registration statement led
with the Securities and Exchange Commission (SEC).
Due to our strong nancial position, we believe that we will continue to be able to effectively access the commercial paper market and long-term capital
markets, if necessary. We believe our cash ows from operations will improve over the long-term due to bene ts from our Business Transformation Project
and initiatives to improve our working capital management and cash ows from the operations of US Foods once acquired.
Cash Flows
Operating Activities
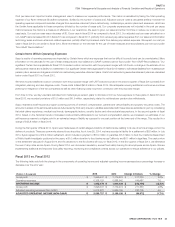
Fiscal 2014 vs. Fiscal 2013
We generated $1.49 billion in cash ow from operations in scal 2014, as compared to $1.51 billion in scal 2013. This decrease of $18.8 million,
or 1.2%, was largely attributable to a negative comparison on pension expense and contributions, reduced net earnings, a negative comparison
on multiemployer pension withdrawal provisions and payments and an unfavorable comparison on prepaid expenses. Partially offsetting these
unfavorable comparisons was a favorable comparison on working capital, several signi cant accruals in scal 2014 and an increase in non-cash
depreciation and amortization.
Included in the change in other long-term liabilities was a negative comparison on pension expense and contributions, which contributed $65.0 million to
the unfavorable comparison on cash ow from operations for scal 2014 to scal 2013. Pension expense was $4.8 million and pension contributions were