Sysco 2014 Annual Report Download - page 4
Download and view the complete annual report
Please find page 4 of the 2014 Sysco annual report below. You can navigate through the pages in the report by either clicking on the pages listed below, or by using the keyword search tool below to find specific information within the annual report.-
 1
1 -
 2
2 -
 3
3 -
 4
4 -
 5
5 -
 6
6 -
 7
7 -
 8
8 -
 9
9 -
 10
10 -
 11
11 -
 12
12 -
 13
13 -
 14
14 -
 15
15 -
16
-
17
-
18
-
19
-
20
-
21
-
22
-
23
-
24
-
25
-
26
-
27
-
28
-
29
-
30
-
31
-
32
-
33
-
34
-
35
-
36
-
37
-
38
-
39
-
40
-
41
-
42
-
43
-
44
-
45
-
46
-
47
-
48
-
49
-
50
-
51
-
52
-
53
-
54
-
55
-
56
-
57
-
58
-
59
-
60
-
61
-
62
-
63
-
64
-
65
-
66
-
67
-
68
-
69
-
70
-
71
-
72
-
73
-
74
-
75
-
76
-
77
-
78
-
79
-
80
-
81
-
82
-
83
-
84
-
85
-
86
-
87
-
88
-
89
-
90
-
91
-
92
-
93
-
94
-
95
-
96
-
97
-
98
-
99
-
100
-
101
-
102
-
103
-
104
-
105
-
106
-
107
-
108
 |
 |

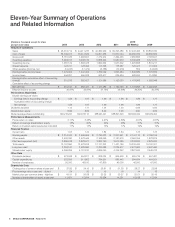
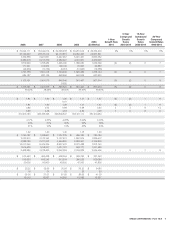
Fiscal Year Ended Percent Change
㛭㛭㛭㛭㛭㛭㛭㛭㛭㛭㛭㛭㛭㛭㛭㛭㛭㛭㛭㛭㛭㛭㛭㛭㛭㛭㛭㛭㛭㛭㛭㛭㛭㛭㛭㛭㛭㛭㛭㛭㛭㛭㛭㛭㛭㛭㛭㛭㛭㛭㛭㛭㛭㛭㛭㛭㛭㛭㛭㛭㛭㛭㛭㛭㛭㛭㛭㛭㛭㛭㛭㛭㛭㛭㛭㛭㛭㛭㛭㛭㛭㛭㛭㛭㛭㛭㛭㛭㛭㛭㛭㛭㛭㛭㛭㛭㛭㛭㛭㛭㛭㛭㛭㛭㛭㛭㛭㛭㛭㛭㛭㛭㛭㛭㛭㛭㛭㛭㛭㛭㛭㛭㛭㛭㛭㛭㛭㛭㛭㛭㛭㛭㛭㛭㛭㛭㛭㛭㛭㛭㛭㛭㛭㛭㛭㛭㛭㛭㛭㛭㛭㛭㛭㛭㛭㛭㛭㛭㛭㛭㛭㛭㛭㛭㛭㛭㛭㛭㛭㛭㛭㛭㛭㛭㛭㛭㛭㛭㛭㛭㛭㛭㛭㛭㛭㛭㛭 㛭㛭㛭㛭㛭㛭㛭㛭㛭㛭㛭㛭㛭㛭㛭㛭㛭㛭㛭㛭㛭㛭㛭㛭㛭㛭㛭㛭㛭㛭㛭
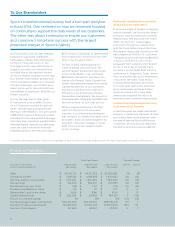
DOLLARS IN THOUSANDS, June 28, 2014 June 29, 2013 June 30, 2012 2014–13 2013–12
EXCEPT FOR PER SHARE DATA (52 weeks) (52 weeks) (52 weeks)
㛭㛭㛭㛭㛭㛭㛭㛭㛭㛭㛭㛭㛭㛭㛭㛭㛭㛭㛭㛭㛭㛭㛭㛭㛭㛭㛭㛭㛭㛭㛭㛭㛭㛭㛭㛭㛭㛭㛭㛭㛭㛭㛭㛭㛭㛭㛭㛭㛭㛭㛭㛭㛭㛭㛭㛭㛭㛭㛭㛭㛭㛭㛭㛭㛭㛭㛭㛭㛭㛭㛭㛭㛭㛭㛭㛭㛭㛭㛭㛭㛭㛭㛭㛭㛭㛭㛭㛭㛭㛭㛭㛭㛭㛭㛭㛭㛭㛭㛭㛭㛭㛭㛭㛭㛭㛭㛭㛭㛭㛭㛭㛭㛭㛭㛭㛭㛭㛭㛭㛭㛭㛭㛭㛭㛭㛭㛭㛭㛭㛭㛭㛭㛭㛭㛭㛭㛭㛭㛭㛭㛭㛭㛭㛭㛭㛭㛭㛭㛭㛭㛭㛭㛭㛭㛭㛭㛭㛭㛭㛭㛭㛭㛭㛭㛭㛭㛭㛭㛭㛭㛭㛭㛭㛭㛭㛭㛭㛭㛭㛭㛭㛭㛭㛭㛭㛭㛭 㛭㛭㛭㛭㛭㛭㛭㛭㛭㛭㛭㛭㛭㛭㛭㛭㛭㛭㛭㛭㛭㛭㛭㛭㛭㛭㛭㛭㛭㛭㛭
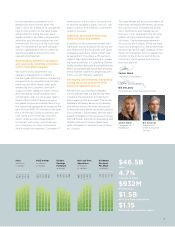
Sales $ 46,516,712 $ 44,411,233 $ 42,380,939 5% 5%
Operating income $ 1,587,122 $ 1,658,478 $ 1,890,632 (4) (12)
Earnings before income taxes $ 1,475,624 $ 1,547,455 $ 1,784,002 (5) (13)
Net earnings $ 931,533 $ 992,427 $ 1,121,585 (6) (12)
Diluted earnings per share $ 1.58 $ 1.67 $ 1.90 (5) (12)
Dividends declared per share $ 1.15 $ 1.11 $ 1.07 4 4
Shareholders’ equity per share $ 8.99 $ 8.86 $ 8.00 1 11
Capital expenditures $ 523,206 $ 511,862 $ 784,501 2 (35)
Return on invested capital 11% 13% 15% (15) (13)
Diluted average shares outstanding 590,216,220 592,675,110 588,991,441 (0) 1
Number of shares repurchased 10,059,000 21,672,403 10,000,000 (54) 117
Number of employees 50,300 48,100 47,800 5 1
㛭㛭㛭㛭㛭㛭㛭㛭㛭㛭㛭㛭㛭㛭㛭㛭㛭㛭㛭㛭㛭㛭㛭㛭㛭㛭㛭㛭㛭㛭㛭㛭㛭㛭㛭㛭㛭㛭㛭㛭㛭㛭㛭㛭㛭㛭㛭㛭㛭㛭㛭㛭㛭㛭㛭㛭㛭㛭㛭㛭㛭㛭㛭㛭㛭㛭㛭㛭㛭㛭㛭㛭㛭㛭㛭㛭㛭㛭㛭㛭㛭㛭㛭㛭㛭㛭㛭㛭㛭㛭㛭㛭㛭㛭㛭㛭㛭㛭㛭㛭㛭㛭㛭㛭㛭㛭㛭㛭㛭㛭㛭㛭㛭㛭㛭㛭㛭㛭㛭㛭㛭㛭㛭㛭㛭㛭㛭㛭㛭㛭㛭㛭㛭㛭㛭㛭㛭㛭㛭㛭㛭㛭㛭㛭㛭㛭㛭㛭㛭㛭㛭㛭㛭㛭㛭㛭㛭㛭㛭㛭㛭㛭㛭㛭㛭㛭㛭㛭㛭㛭㛭㛭㛭㛭㛭㛭㛭㛭㛭㛭㛭㛭㛭㛭㛭㛭㛭 㛭㛭㛭㛭㛭㛭㛭㛭㛭㛭㛭㛭㛭㛭㛭㛭㛭㛭㛭㛭㛭㛭㛭㛭㛭㛭㛭㛭㛭㛭㛭
Financial Highlights
Sysco’s transformational journey had a two-part storyline
in fiscal 2014. One centered on how we remained focused
on continuing to support the daily needs of our customers.
The other was about continuing to ensure our customers’
and company’s long-term success with the largest
proposed merger in Sysco’s history.
To Our Shareholders
On the business side, the year reflected
aperiod of significant challenges,
tremendous change, and solid progress
forSysco. Financial results in the
firsteight months were affected by a
sluggish economic environment that
included one of the harshest winters
onrecord. Market conditions in the final
four months improved as general eco-
nomic conditions picked up. In the face
of these challenges, our 50,000 asso-
ciates continued to demonstrate their
commitment to helping our 425,000 cus-
tomers succeed.
During the year, Sysco sales grew
4.7percent to a record $46.5 billion
ona 3.4 percent increase in case vol-
umes. Net earnings and adjusted net
earnings(1) were $1 billion. Our gross profit
of $8.2 billion was a 2.3 percent increase
compared to the same period a year ago.
Cash flow from operations was $1.5billion.
We meaningfully reduced our operating
costs per case in the North American
broadline business. Wereturned nearly
$670 million in dividends to shareholders
and increased our dividend for the 45th
timein our 44-year history.
On Dec. 9, 2013, we announced our
intentto merge with US Foods, the
second-largest foodservice distributor
in the United States, in an estimated
$8.2 billion transaction. Pending com-
pletion of a Federal Trade Commission
review, the proposed merger will provide
substantial benefits to our customers
and help us achieve more scale and
efficiency in an evolving and highly
competitive marketplace. We expect to
achieve benefits totaling at least $600 mil-
lion over a three- to four-year period.
While a substantial amount of effort
went into the actions driving each
storyline, our collective perseverance
was rooted in our leadership team’s and
associates’ ability to achieve against our
long-term, five-point strategy. In fiscal
2014, here’s how we made progress
onthis strategy:
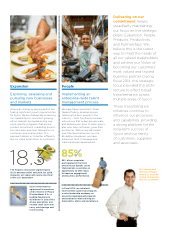
Profoundly enriching the experience
ofdoing business with Sysco
In an environment of modest underlying
industry growth, we focused on deep-
ening our local and national customer
relationships. We launched the “Ingre-
dients for Success” sweepstakes
promotion through our relationship
with the Food Network and the show
Restaurant: Impossible, resulting in the
participation of 17,000 U.S. customers.
The grand prize winner received $10,000
in Sysco credit and a visit to their
restaurant from celebrity chef Robert
Irvine. In June, Sysco hosted many
customers at the FARE 2014 industry
conference in Grapevine, Texas, where
they received a high-touch experience
of business seminars, food shows,
cooking demonstrations and more.
Ourlocal sales teams also launched
three nationwide customer blitzes,
which provided a lift in new sales
revenue and opened the doors to
numerous new customer relationships.
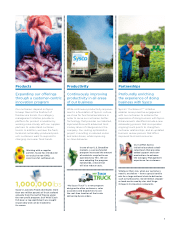
Continuously improving productivity
in all areas of the business
In the fiscal year, we made substantial
progress in optimizing the areas of deliv-
ery routing, fleet, and equipment with
the goal of gaining future efficiencies.
Inaddition, we successfully deployed
the SAP enterprise resource platform
2
(1) See “Non-GAAP Reconciliations” within our Annual Report on Form 10-K for the fiscal year ended June 28, 2014, for an explanation of these non-GAAP measures.