Sysco 2014 Annual Report Download - page 93
Download and view the complete annual report
Please find page 93 of the 2014 Sysco annual report below. You can navigate through the pages in the report by either clicking on the pages listed below, or by using the keyword search tool below to find specific information within the annual report.-
 1
1 -
2
-
3
-
4
-
5
-
6
-
7
-
8
-
9
-
10
-
11
-
12
-
13
-
14
-
15
-
16
-
17
-
18
-
19
-
20
-
21
-
22
-
23
-
24
-
25
-
26
-
27
-
28
-
29
-
30
-
31
-
32
-
33
-
34
-
35
-
36
-
37
-
38
-
39
-
40
-
41
-
42
-
43
-
44
-
45
-
46
-
47
-
48
-
49
-
50
-
51
-
52
-
53
-
54
-
55
-
56
-
57
-
58
-
59
-
60
-
61
-
62
-
63
-
64
-
65
-
66
-
67
-
68
-
69
-
70
-
71
-
72
-
73
-
74
-
75
-
76
-
77
-
78
-
79
-
80
-
81
-
82
-
 83
83 -
 84
84 -
 85
85 -
 86
86 -
 87
87 -
 88
88 -
 89
89 -
 90
90 -
 91
91 -
 92
92 -
 93
93 -
 94
94 -
 95
95 -
 96
96 -
 97
97 -
 98
98 -
 99
99 -
 100
100 -
 101
101 -
 102
102 -
 103
103 -
104
-
105
-
106
-
107
-
108
 |
 |

SYSCO CORPORATION-Form10-K 81
PARTII
ITEM8Financial Statements and Supplementary Data
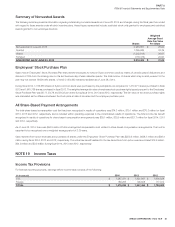
Summary of Nonvested Awards
The following summary presents information regarding outstanding nonvested awards as of June 28, 2014 and changes during the scal year then ended
with regard to these awards under all stock incentive plans. Award types represented include: restricted stock units granted to employees and restricted
awards granted to non-employee directors.
Shares
Weighted
Average Grant
Date Fair Value
Per Share
Nonvested as of June 29, 2013 2,933,807 $ 28.90
Granted 1,365,986 33.39
Vested (1,202,913) 28.67
Forfeited (178,475) 29.50
NONVESTED AS OF JUNE 29, 2013 2,918,405 $ 31.06
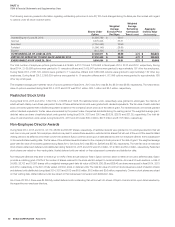
Employees’ Stock Purchase Plan
Sysco has an Employees’ Stock Purchase Plan that permits employees to invest in Sysco common stock by means of periodic payroll deductions at a
discount of 15% from the closing price on the last business day of each calendar quarter. The total number of shares which may be sold pursuant to the
plan may not exceed 79,000,000 shares, of which 2,454,932 remained available as of June 28, 2014.
During scal 2014, 1,315,535 shares of Sysco common stock were purchased by the participants, as compared to 1,470,271 shares purchased in scal
2013 and 1,661,758 shares purchased in scal 2012. The weighted average fair value of employee stock purchase rights issued pursuant to the Employees’
Stock Purchase Plan was $5.17, $4.78 and $4.33 per share during scal 2014, 2013 and 2012, respectively. The fair value of the stock purchase rights
was calculated as the difference between the stock price at date of issuance and the employee purchase price.
All Share-Based Payment Arrangements
The total share-based compensation cost that has been recognized in results of operations was $74.3 million, $70.1 million and $70.3 million for scal
2014, 2013 and 2012, respectively, and is included within operating expenses in the consolidated results of operations. The total income tax bene t
recognized in results of operations for share-based compensation arrangements was $28.1 million, $29.9 million and $21.7 million for scal 2014, 2013
and 2012, respectively.
As of June 28, 2014, there was $64.9 million of total unrecognized compensation cost related to share-based compensation arrangements. That cost is
expected to be recognized over a weighted-average period of 2.39 years.
Cash received from option exercises and purchases of shares under the Employees’ Stock Purchase Plan was $255.6 million, $628.7 million and $99.4
million during scal 2014, 2013 and 2012, respectively. The actual tax bene t realized for the tax deductions from option exercises totaled $16.6 million,
$24.0 million and $3.0 million during scal 2014, 2013 and 2012, respectively.
NOTE19 Income Taxes
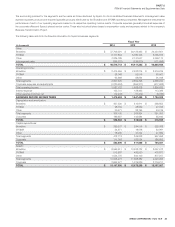
Income Tax Provisions
For nancial reporting purposes, earnings before income taxes consists of the following:
(Inthousands)
2014 2013 2012
U.S. $ 1,287,371 $ 1,351,947 $ 1,606,928
Foreign 188,253 195,508 177,074
TOTAL $ 1,475,624 $ 1,547,455 $ 1,784,002