Sysco 2014 Annual Report Download - page 30
Download and view the complete annual report
Please find page 30 of the 2014 Sysco annual report below. You can navigate through the pages in the report by either clicking on the pages listed below, or by using the keyword search tool below to find specific information within the annual report.-
 1
1 -
2
-
3
-
4
-
5
-
6
-
7
-
8
-
9
-
10
-
11
-
12
-
13
-
14
-
15
-
16
-
17
-
18
-
19
-
 20
20 -
 21
21 -
 22
22 -
 23
23 -
 24
24 -
 25
25 -
 26
26 -
 27
27 -
 28
28 -
 29
29 -
 30
30 -
 31
31 -
 32
32 -
 33
33 -
 34
34 -
 35
35 -
 36
36 -
 37
37 -
 38
38 -
 39
39 -
 40
40 -
41
-
42
-
43
-
44
-
45
-
46
-
47
-
48
-
49
-
50
-
51
-
52
-
53
-
54
-
55
-
56
-
57
-
58
-
59
-
60
-
61
-
62
-
63
-
64
-
65
-
66
-
67
-
68
-
69
-
70
-
71
-
72
-
73
-
74
-
75
-
76
-
77
-
78
-
79
-
80
-
81
-
82
-
83
-
84
-
85
-
86
-
87
-
88
-
89
-
90
-
91
-
92
-
93
-
94
-
95
-
96
-
97
-
98
-
99
-
100
-
101
-
102
-
103
-
104
-
105
-
106
-
107
-
108
 |
 |
SYSCO CORPORATION-Form10-K18
PARTII
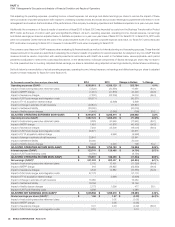
ITEM6Selected Financial Data
ITEM6 Selected Financial Data
(Inthousands except for per share data)
Fiscal Year
2014 2013 2012 2011
2010
(53 Weeks)
Sales $ 46,516,712 $ 44,411,233 $ 42,380,939 $ 39,323,489 $ 37,243,495
Operating income 1,587,122 1,658,478 1,890,632 1,931,502 1,975,868
Earnings before income taxes 1,475,624 1,547,455 1,784,002 1,827,454 1,849,589
Income taxes 544,091 555,028 662,417 675,424 669,606
NET EARNINGS $ 931,533 $ 992,427 $ 1,121,585 $ 1,152,030 $ 1,179,983
Net earnings:
BASIC EARNINGS PER SHARE $ 1.59 $ 1.68 $ 1.91 $ 1.96 $ 1.99
DILUTED EARNINGS PER SHARE 1.58 1.67 1.90 1.96 1.99
Dividends declared per share $ 1.15 $ 1.11 $ 1.07 $ 1.03 $ 0.99
Total assets $ 13,167,950 $ 12,678,208 $ 12,137,207 $ 11,427,190 $ 10,336,436
Capital expenditures 523,206 511,862 784,501 636,442 594,604
Current maturities of long-term debt $ 304,777 $ 207,301 $ 254,650 $ 207,031 $ 7,970
Long-term debt 2,384,167 2,639,986 2,763,688 2,279,517 2,472,662
Total long-term debt 2,688,944 2,847,287 3,018,338 2,486,548 2,480,632
Shareholders’ equity 5,266,695 5,191,810 4,685,040 4,705,242 3,827,526
TOTAL CAPITALIZATION $ 7,955,639 $ 8,039,097 $ 7,703,378 $ 7,191,790 $ 6,308,158
Ratio of long-term debt to capitalization 33.8% 35.4% 39.2% 34.6% 39.3%
ITEM7 Management’s Discussion and Analysis
ofFinancial Condition and Results of Operations
Our discussion below of our results includes certain non-GAAP nancial measures that we believe provide important perspective with respect to underlying
business trends and results and provides meaningful supplemental information to both management and investors that is indicative of the performance
of the company’s underlying operations and facilitates comparison on a year-over-year basis. Other than free cash ow, any non-GAAP nancial measure
will be denoted as an adjusted measure and exclude the impact from executive retirement plans restructuring, multiemployer pension withdrawals,
severance charges, merger and integration costs associated with our pending US Foods, Inc. (US Foods) merger, change in estimate for self-insurance
costs, charges from a liability for a settlement, facility closure charges, amortization of US Foods nancing costs and an acquisition related charge speci c
to scal 2013, collectively de ned as (Certain Items). The comparison of our scal 2013 and scal 2012 periods also excludes the impact of our Business
Transformation Project. More information on the rationale for the use of these measures and reconciliations to GAAP numbers can be found under “Non-
GAAP Reconciliations.”
Due to the inherent uncertainties concerning the impact of the pending US Foods acquisition (see discussion in Risk Factors in Part 1, Item 1A.), it is
impracticable for us to provide projections that fully anticipate all possible impacts of the acquisition. For that reason, forward-looking disclosures in this
MD&A and elsewhere describe anticipated future trends and results of only our current operations, excluding any potential impact from the US Foods
acquisition unless speci cally noted.
Overview
Sysco distributes food and related products to restaurants, healthcare and educational facilities, lodging establishments and other foodservice customers.
Our operations are primarily located throughout the United States (U.S.), Bahamas, Canada, Republic of Ireland and Northern Ireland and include broadline
companies (which include our custom-cut meat operations), SYGMA (our chain restaurant distribution subsidiary), specialty produce companies, hotel
supply operations, a company that distributes specialty imported products, a company that distributes to international customers and our Sysco Ventures
platform, our suite of technology solutions that help support the business needs of our customers.
We consider our primary market to be the foodservice market in the U.S., Canada and Ireland and estimate that we serve about 17.4% of this approximately
$255 billion annual market based on a measurement as of the end of calendar 2013. We use industry data obtained from various sources including
Technomic, Inc., the Canadian Restaurant and Foodservices Association and the Irish Food Board to calculate this measurement. Industry sources adjust