Sysco 2014 Annual Report Download - page 73
Download and view the complete annual report
Please find page 73 of the 2014 Sysco annual report below. You can navigate through the pages in the report by either clicking on the pages listed below, or by using the keyword search tool below to find specific information within the annual report.-
 1
1 -
2
-
3
-
4
-
5
-
6
-
7
-
8
-
9
-
10
-
11
-
12
-
13
-
14
-
15
-
16
-
17
-
18
-
19
-
20
-
21
-
22
-
23
-
24
-
25
-
26
-
27
-
28
-
29
-
30
-
31
-
32
-
33
-
34
-
35
-
36
-
37
-
38
-
39
-
40
-
41
-
42
-
43
-
44
-
45
-
46
-
47
-
48
-
49
-
50
-
51
-
52
-
53
-
54
-
55
-
56
-
57
-
58
-
59
-
60
-
61
-
62
-
 63
63 -
 64
64 -
 65
65 -
 66
66 -
 67
67 -
 68
68 -
 69
69 -
 70
70 -
 71
71 -
 72
72 -
 73
73 -
 74
74 -
 75
75 -
 76
76 -
 77
77 -
 78
78 -
 79
79 -
 80
80 -
 81
81 -
 82
82 -
 83
83 -
84
-
85
-
86
-
87
-
88
-
89
-
90
-
91
-
92
-
93
-
94
-
95
-
96
-
97
-
98
-
99
-
100
-
101
-
102
-
103
-
104
-
105
-
106
-
107
-
108
 |
 |

SYSCO CORPORATION-Form10-K 61
PARTII
ITEM8Financial Statements and Supplementary Data
As of the time the merger agreement was announced in December 2013, Sysco agreed to pay approximately $3.5 billion for the equity of US Foods,
comprised of $3 billion of Sysco common stock and $500 million of cash. As part of the transaction, Sysco will also assume or re nance US Foods’ net debt,
which was approximately $4.7 billion as of September 28, 2013, bringing the total enterprise value to $8.2 billion at the time of the merger announcement.
As of August 13, 2014, the merger consideration is estimated as follows: approximately $3.7 billion for the equity of US Foods, comprised of $3.2 billion
of Sysco common stock valued using the seven day average through August 13, 2014, and $500 million of cash. US Foods’ net debt to be assumed or
re nanced was approximately $4.8 billion as of June 28, 2014, bringing the total enterprise value to $8.5 billion as of August 13, 2014. The value of Sysco’s
common stock and the amount of US Foods’ net debt will uctuate. As such, the components of the transaction and total enterprise value noted above
will not be nalized until the merger is consummated.
Sysco has secured a fully committed bridge nancing that could be used for funding a portion of the purchase price. After completion of the transaction,
the equity holders of US Foods will own approximately 87 million shares, or roughly 13% of Sysco. A representative from each of US Foods’ two majority
shareholders will join Sysco’s Board of Directors upon closing. This merger is currently pending a regulatory review process by the Federal Trade Commission.
The company estimates the merger will close by the end of the third quarter or in the fourth quarter of calendar 2014. Under certain conditions, including
lack of regulatory approval, Sysco would be obligated to pay $300 million to the owners of US Foods if the merger were cancelled.
NOTE5 Fair Value Measurements
Fair value is de ned as the price that would be received to sell an asset or paid to transfer a liability in an orderly transaction between market participants
at the measurement date (i.e., an exit price). The accounting guidance includes a fair value hierarchy that prioritizes the inputs to valuation techniques used
to measure fair value. The three levels of the fair value hierarchy are as follows:
•Level 1 – Unadjusted quoted prices for identical assets or liabilities in active markets;
•
Level 2 – Inputs other than quoted prices in active markets for identical assets and liabilities that are observable either directly or indirectly for substantially
the full term of the asset or liability; and
•
Level 3 – Unobservable inputs for the asset or liability, which include management’s own assumption about the assumptions market participants would
use in pricing the asset or liability, including assumptions about risk.
Sysco’s policy is to invest in only high-quality investments. Cash equivalents primarily include time deposits, certi cates of deposit, commercial paper,
high-quality money market funds and all highly liquid instruments with original maturities of three months or less. Restricted cash consists of investments
in high-quality money market funds.
The following is a description of the valuation methodologies used for assets measured at fair value.
•
Time deposits and commercial paper included in cash equivalents are valued at amortized cost, which approximates fair value. These are included
within cash equivalents as a Level 2 measurement in the tables below.
•
Money market funds are valued at the closing price reported by the fund sponsor from an actively traded exchange. These are included within cash
equivalents and restricted cash as Level 1 measurements in the tables below.
•
The interest rate swap agreements, discussed further in Note 9, “Derivative Financial Instruments,” are valued using a swap valuation model that utilizes
an income approach using observable market inputs including interest rates, LIBOR swap rates and credit default swap rates. These are included within
prepaid expenses and other current assets, other assets and accrued expenses as Level 2 measurements in the tables below.
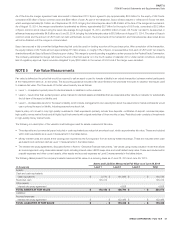
The following tables present the company’s assets measured at fair value on a recurring basis as of June 28, 2014 and June 29, 2013:
(Inthousands)
Assets and Liabilities Measured at Fair Value as of June 28, 2014
Level1 Level2 Level3 Total
Assets:
Cash and cash equivalents
Cash equivalents $ 2,770 $ 131,966 $ - $ 134,736
Restricted cash 145,412 - - 145,412
Other assets
Interest rate swap agreement - 4,828 - 4,828
TOTAL ASSETS AT FAIR VALUE $ 148,182 $ 136,794 $ - $ 284,976
Liabilities:
Accrued expenses
Interest rate swap agreement $ - $ 133,466 $ - $ 133,466
TOTAL LIABILITIES AT FAIR VALUE $ - $ 133,466 $ - $ 133,466