Sysco 2014 Annual Report Download - page 35
Download and view the complete annual report
Please find page 35 of the 2014 Sysco annual report below. You can navigate through the pages in the report by either clicking on the pages listed below, or by using the keyword search tool below to find specific information within the annual report.-
 1
1 -
2
-
3
-
4
-
5
-
6
-
7
-
8
-
9
-
10
-
11
-
12
-
13
-
14
-
15
-
16
-
17
-
18
-
19
-
20
-
21
-
22
-
23
-
24
-
 25
25 -
 26
26 -
 27
27 -
 28
28 -
 29
29 -
 30
30 -
 31
31 -
 32
32 -
 33
33 -
 34
34 -
 35
35 -
 36
36 -
 37
37 -
 38
38 -
 39
39 -
 40
40 -
 41
41 -
 42
42 -
 43
43 -
 44
44 -
 45
45 -
46
-
47
-
48
-
49
-
50
-
51
-
52
-
53
-
54
-
55
-
56
-
57
-
58
-
59
-
60
-
61
-
62
-
63
-
64
-
65
-
66
-
67
-
68
-
69
-
70
-
71
-
72
-
73
-
74
-
75
-
76
-
77
-
78
-
79
-
80
-
81
-
82
-
83
-
84
-
85
-
86
-
87
-
88
-
89
-
90
-
91
-
92
-
93
-
94
-
95
-
96
-
97
-
98
-
99
-
100
-
101
-
102
-
103
-
104
-
105
-
106
-
107
-
108
 |
 |

SYSCO CORPORATION-Form10-K 23
PARTII
ITEM7Management’s Discussion and Analysis ofFinancial Condition and Results of Operations
Sales
Sales for scal 2014 were 4.7% higher than scal 2013. Sales for scal 2014 increased as a result of product cost in ation and the resulting increase in
selling prices, case volume growth, and sales from acquisitions that occurred within the last 12 months. Our sales growth in scal 2014 was greater with
our corporate-managed customers as compared to sales growth with our locally-managed customers. We believe our locally-managed customer growth
has been negatively in uenced by market conditions including lower consumer spend. The disparity in the growth rate between these customer types
moderated in the last half of scal 2014, with locally-managed sales growth trending at similar rates as corporate-managed customers. Changes in product
costs, an internal measure of in ation or de ation, were estimated as in ation of 2.1% during scal 2014, driven mainly by in ation in the meat, seafood
and dairy categories. Case volumes including acquisitions within the last 12 months improved 3.4% in scal 2014. Case volumes excluding acquisitions
within the last 12 months improved 2.2% in scal 2014. Our case volumes represent our results from our Broadline and SYGMA segments combined.
Sales from acquisitions within the last 12 months favorably impacted sales by 1.4% in scal 2014. The changes in the exchange rates used to translate
our foreign sales into U.S. dollars negatively impacted sales by 0.7% in scal 2014.
Sales for scal 2013 were 4.8% higher than scal 2012. Sales for scal 2013 increased as a result of product cost in ation and the resulting increase in
selling prices, sales from acquisitions that occurred within the last 12 months and case volume growth. Our sales growth in scal 2013 was greater with
our corporate-managed customers as compared to sales growth with our locally-managed customers. We believe our locally-managed customer sales
growth was negatively in uenced by lower consumer sentiment. Case volumes excluding acquisitions within the last 12 months improved 1.3% in scal
2013. Our case volumes represent our results from our Broadline and SYGMA segments only. Sales from acquisitions within the last 12 months favorably
impacted sales by 1.5% for scal 2013. Case volumes including acquisitions within the last 12 months improved approximately 2.6% in scal 2013. Changes
in product costs, an internal measure of in ation or de ation, were estimated as in ation of 2.2% during scal 2013. The changes in the exchange rates
used to translate our foreign sales into U.S. dollars did not have a signi cant impact on sales when compared to scal 2012.
Operating Income
Cost of sales primarily includes our product costs, net of vendor consideration, and includes in-bound freight. Operating expenses include the costs of
facilities, product handling, delivery, selling and general and administrative activities. Fuel surcharges are re ected within sales and gross pro t; fuel costs
are re ected within operating expenses.
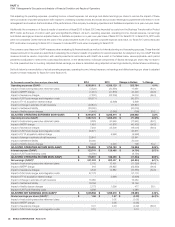
Fiscal 2014 vs. Fiscal 2013
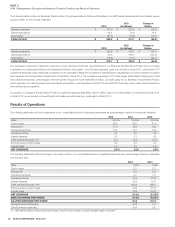
The following table sets forth the change in the components of operating income and adjusted operating income expressed as a percentage increase or
decrease over the prior year:
(Dollars inthousands)
2014 2013 Change inDollars % Change
Gross pro t $ 8,181,035 $ 7,996,607 $ 184,428 2.3%
Operating expenses 6,593,913 6,338,129 255,784 4.0
OPERATING INCOME $ 1,587,122 $ 1,658,478 $ (71,356 ) (4.3 )%
Gross pro t $ 8,181,035 $ 7,996,607 $ 184,428 2.3%
Adjusted operating expenses (Non-GAAP) 6,444,076 6,243,414 200,662 3.2
ADJUSTED OPERATING INCOME (NON-GAAP) $ 1,736,959 $ 1,753,193 $ (16,234) (0.9)%
The decrease in operating income was impacted by an increase in $55.1 million in operating expenses attributable to Certain Items. Operating income
and adjusted operating income for scal 2014 were lower than scal 2013 primarily from a lower rate of growth in our gross pro t, increased expenses
from higher case volumes, some of which is attributable to our acquired operations, increased depreciation and amortization, increased delivery costs and
higher corporate expenses. These were partially offset by lower Business Transformation Project expenses and bene ts from Business Transformation
Project initiatives. As a percentage of sales, we experienced favorable expense management due in part to bene ts from our Business Transformation
Project initiatives.
Gross pro t dollars increased in scal 2014 as compared to scal 2013 primarily due to increased sales volumes. The rst half of scal 2014 contained
weaker gross pro t growth of 1.2% as compared to the same period in scal 2013. In ation and locally-managed customers case growth was lower in the
rst half of scal 2014. In ation increased as did local-managed customers case growth in the second half of scal 2014. Gross pro ts grew at a greater
rate of 3.4% in the second half of scal 2014 as compared to the same time period in scal 2013 as result of these factors and in part from our Business
Transformation Project initiatives. Gross margin, which is gross pro t as a percentage of sales, was 17.59% in scal 2014, a decline of 42 basis points
from the gross margin of 18.01% in scal 2013. This decline in gross margin was partially the result of weak restaurant traf c and increased competition
resulting from a slow-growth market. Increased sales to lower margin corporate-managed customers also contributed to the decline in scal 2014. These
customers purchase higher volumes and therefore margins tend to be lower with this customer group than our locally-managed customers. Our locally-
managed customers comprise a signi cant portion of our overall volumes and an even greater percentage of pro tability because of the high level of value
added services we typically provide to this customer group. The disparity in the growth rate between these customer types moderated in the last half of
scal 2014 with locally-managed sales growth trending at similar rates as corporate-managed customers. If sales from our locally-managed customers