Sysco 2014 Annual Report Download - page 40
Download and view the complete annual report
Please find page 40 of the 2014 Sysco annual report below. You can navigate through the pages in the report by either clicking on the pages listed below, or by using the keyword search tool below to find specific information within the annual report.-
 1
1 -
2
-
3
-
4
-
5
-
6
-
7
-
8
-
9
-
10
-
11
-
12
-
13
-
14
-
15
-
16
-
17
-
18
-
19
-
20
-
21
-
22
-
23
-
24
-
25
-
26
-
27
-
28
-
29
-
 30
30 -
 31
31 -
 32
32 -
 33
33 -
 34
34 -
 35
35 -
 36
36 -
 37
37 -
 38
38 -
 39
39 -
 40
40 -
 41
41 -
 42
42 -
 43
43 -
 44
44 -
 45
45 -
 46
46 -
 47
47 -
 48
48 -
 49
49 -
 50
50 -
51
-
52
-
53
-
54
-
55
-
56
-
57
-
58
-
59
-
60
-
61
-
62
-
63
-
64
-
65
-
66
-
67
-
68
-
69
-
70
-
71
-
72
-
73
-
74
-
75
-
76
-
77
-
78
-
79
-
80
-
81
-
82
-
83
-
84
-
85
-
86
-
87
-
88
-
89
-
90
-
91
-
92
-
93
-
94
-
95
-
96
-
97
-
98
-
99
-
100
-
101
-
102
-
103
-
104
-
105
-
106
-
107
-
108
 |
 |

SYSCO CORPORATION-Form10-K28
PARTII
ITEM7Management’s Discussion and Analysis ofFinancial Condition and Results of Operations
that adjusting its operating expenses, operating income, interest expense, net earnings and diluted earnings per share to remove the impact of these
items provides an important perspective with respect to underlying business trends and results and provides meaningful supplemental information to both
management and investors that is indicative of the performance of the company’s underlying operations and facilitates comparison on a year-over-year basis.
Additionally, the comparison of Sysco’s results of operations of scal 2013 to scal 2012 was impacted by costs from the Business Transformation Project
(BTP costs), as the level of costs in each year was signi cantly different. As such, operating expenses, operating income, interest expense, net earnings
and diluted earnings per share are adjusted below to facilitate comparison on a year-over-year basis of scal 2013 to scal 2012. In scal 2014, BTP costs
were not considered Certain Items as the costs of this project became a part of our general corporate expense; as a result, our scal 2013 period excludes
BTP costs when comparing to scal 2014, however it includes BTP costs when comparing to scal 2012.
The company uses these non-GAAP measures when evaluating its nancial results as well as for internal planning and forecasting purposes. These nancial
measures should not be used as a substitute in assessing the company’s results of operations for periods presented. An analysis of any non-GAAP nancial
measure should be used in conjunction with results presented in accordance with GAAP. As a result, in the tables below, where applicable, each period
presented is adjusted to remove the costs described above. In the tables below, individual components of diluted earnings per share may not add to
the total presented due to rounding. Adjusted diluted earnings per share is calculated using adjusted net earnings divided by diluted shares outstanding.
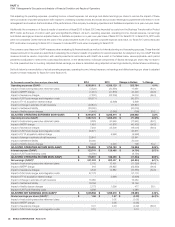
Set forth below is a reconciliation of actual operating expenses, operating income, interest expense, net earnings and diluted earnings per share to adjusted
results for these measures for scal 2014 and scal 2013:
(Inthousands, except for share and per share data)
2014 2013 Change in Dollars % Change
Operating expenses (GAAP) $ 6,593,913 $ 6,338,129 $ 255,784 4.0%
Impact of restructuring executive retirement plans (3,329) (20,990) 17,661 (84.1)
Impact of MEPP charge (1,451) (41,876) 40,425 (96.5)
Impact of severance charges (7,202) (23,206) 16,004 (69.0)
Impact of US Foods merger and integration costs (90,571) - (90,571)
Impact of FY13 acquisition-related charge - (5,998) 5,998
Impact of change in estimate of self insurance (23,841) - (23,841)
Impact of settlement liability (20,000) - (20,000)
Impact of facility closure charges (3,443) (2,645) (798) 30.2
ADJUSTED OPERATING EXPENSES (NON-GAAP) $ 6,444,076 $ 6,243,414 $ 200,662 3.2%
Operating income (GAAP) $ 1,587,122 $ 1,658,478 $ (71,356) (4.3)%
Impact of restructuring executive retirement plans 3,329 20,990 (17,661) (84.1)
Impact of MEPP charge 1,451 41,876 (40,425) (96.5)
Impact of severance charges 7,202 23,206 (16,004) (69.0)
Impact of US Foods merger and integration costs 90,571 - 90,571
Impact of FY13 acquisition-related charge - 5,998 (5,998)
Impact of change in estimate of self insurance 23,841 - 23,841
Impact of settlement liability 20,000 - 20,000
Impact of facility closure charges 3,443 2,645 798 30.2
ADJUSTED OPERATING INCOME (NON-GAAP) $ 1,736,959 $ 1,753,193 $ (16,234) (0.9)%
Interest expense (GAAP) $ 123,741 $ 128,495 $ (4,754) (3.7)%
Impact of US Foods nancing costs (6,790) - (6,790)
ADJUSTED OPERATING INCOME (NON-GAAP) $ 116,951 $ 128,495 $ (11,544) (9.0)%
Net earnings (GAAP)(1) $ 931,533 $ 992,427 $ (60,894) (6.1)%
Impact of restructuring executive retirement plans 2,102 13,461 (11,359) (84.4)
Impact of MEPP charge 916 26,855 (25,939) (96.6)
Impact of severance charges 4,546 14,882 (10,336) (69.5)
Impact of US Foods merger and integration costs 57,176 - 57,176
Impact of FY13 acquisition-related charge - 5,998 (5,998)
Impact of change in estimate of self insurance 15,050 - 15,050
Impact of settlement liability 18,156 - 18,156
Impact of facility closure charges 2,173 1,696 477 28.1
Impact of US Foods nancing costs 4,286 - 4,286
ADJUSTED NET EARNINGS (NON-GAAP)(1) $ 1,035,938 $ 1,055,319 $ (19,381) (1.8)%
Diluted earnings per share (GAAP)(1) $ 1.58 $ 1.67 $ (0.09) (5.4)%
Impact of restructuring executive retirement plans - 0.02 (0.02)
Impact of MEPP charge - 0.05 (0.05)
Impact of severance charges 0.01 0.03 (0.02) (66.7)
Impact of US Foods merger and integration costs 0.10 - 0.10