Sysco 2014 Annual Report Download - page 36
Download and view the complete annual report
Please find page 36 of the 2014 Sysco annual report below. You can navigate through the pages in the report by either clicking on the pages listed below, or by using the keyword search tool below to find specific information within the annual report.-
 1
1 -
2
-
3
-
4
-
5
-
6
-
7
-
8
-
9
-
10
-
11
-
12
-
13
-
14
-
15
-
16
-
17
-
18
-
19
-
20
-
21
-
22
-
23
-
24
-
25
-
 26
26 -
 27
27 -
 28
28 -
 29
29 -
 30
30 -
 31
31 -
 32
32 -
 33
33 -
 34
34 -
 35
35 -
 36
36 -
 37
37 -
 38
38 -
 39
39 -
 40
40 -
 41
41 -
 42
42 -
 43
43 -
 44
44 -
 45
45 -
 46
46 -
47
-
48
-
49
-
50
-
51
-
52
-
53
-
54
-
55
-
56
-
57
-
58
-
59
-
60
-
61
-
62
-
63
-
64
-
65
-
66
-
67
-
68
-
69
-
70
-
71
-
72
-
73
-
74
-
75
-
76
-
77
-
78
-
79
-
80
-
81
-
82
-
83
-
84
-
85
-
86
-
87
-
88
-
89
-
90
-
91
-
92
-
93
-
94
-
95
-
96
-
97
-
98
-
99
-
100
-
101
-
102
-
103
-
104
-
105
-
106
-
107
-
108
 |
 |
SYSCO CORPORATION-Form10-K24
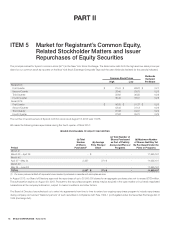
PARTII
ITEM7Management’s Discussion and Analysis ofFinancial Condition and Results of Operations
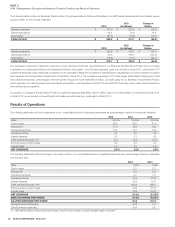
do not grow at the same rate as sales from these corporate-managed customers, our gross margins may continue to decline. Our in ation rates were
relatively stable over the rst three quarters of scal 2014, however it increased in the fourth quarter, all quarters being compared to the past year. Fourth
quarter scal 2014 in ation was seen primarily in the meat, seafood and dairy categories which represent more than one-third of our annual sales. While we
cannot predict whether in ation will continue at current levels, periods of high in ation, either overall or in certain product categories, can have a negative
impact on us and our customers, as high food costs can be dif cult to pass on to our customers and in ation can reduce consumer spending in the food-
away-from-home market, and may negatively impact our sales, gross pro t, operating income and earnings.
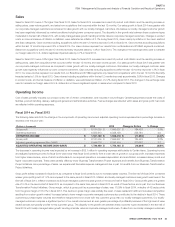
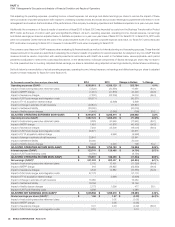
Operating expenses for scal 2014 increased 4.0%, or $255.8 million, over scal 2013. Adjusted operating expenses for scal 2014 increased 3.2%, or
$200.7 million, over scal 2013. These increases were primarily due to increased expenses from higher case volumes, some of which is attributable to our
acquired operations, increased depreciation and amortization, increased delivery costs and higher corporate expenses. These were partially offset by lower
Business Transformation Project expenses and bene ts from Business Transformation Project initiatives. We believe favorable expense management, partially
from our Business Transformation Project initiatives, helped to keep our operating expense increases from being greater. Sysco’s operating expenses are
impacted by certain charges and adjustments, which we refer to as Certain Items, and which resulted in an increase in operating expenses of $55.1million
in scal 2014 as compared to scal 2013. More information on the rationale of the use of these measures and reconciliations to GAAP numbers can be
found under “Non-GAAP Reconciliations.”
Operating Expenses Impacting Adjusted Operating Income
Our operating expenses increased in scal 2014 as compared to scal 2013 partially due to expenses from our acquired operations, expenses attributable
to volume growth and increased delivery costs. Pay-related expenses represent a signi cant portion of our operating costs, contributed to the increase
in each of these three categories of expenses and contributed to cost increases in our corporate expenses. Pay-related expenses, excluding labor costs
associated with our Business Transformation Project, US Foods integration planning and retirement-related expenses, increased by $74.4 million in scal
2014 over scal 2013. The increase was primarily due to costs from companies acquired in the last 12 months as well as increased delivery and warehouse
compensation, partially attributable to case growth. Pay-related costs have also increased at our corporate of ce as certain employee costs attributed to our
Business Transformation Project in scal 2013 are no longer attributed to the Business Transformation Project in scal 2014 due to a change in allocation
methodology. In scal 2013, we allocated internal associates based upon estimates of the percentage of time they spent on the project. In scal 2014,
only associates that that are dedicated full time to the project are included in Business Transformation Project costs. These increases were partially offset
by reduced sales compensation, information technology compensation and lower provisions for management incentive plans. Bene ts from our Business
Transformation Project initiatives have helped in lowering the rate of growth in these expenses particularly in our sales area for scal 2014. During scal
2013, we streamlined our sales management organization and modi ed marketing associate compensation plans. Fiscal 2014 was also impacted by a
reduction in pay in the information technology area, resulting from the restructuring of this department in scal 2013, which reduced headcount in this area.
Depreciation and amortization expense, excluding the increase related to our Business Transformation Project described below, increased by $32.8 million
in scal 2014 over scal 2013. The increase was primarily related to depreciation on assets that were not placed in service in scal 2013 that were in
service in scal 2014.
Our retirement-related expenses consist primarily of costs from our Retirement Plan, SERP and our de ned contribution plans. As a part of our Business
Transformation Project initiatives, our Retirement Plan was substantially frozen and the SERP was completely frozen in scal 2013, and our de ned
contribution plans were enhanced with greater bene ts. The net impact in scal 2014 of our retirement-related expenses as compared to scal 2013 was
a decrease of $86.8 million, consisting of a $133.6 million decrease in our net company-sponsored pension costs and approximately $6.2 million for other
costs, partially offset by $53.0 million increased costs from our de ned contribution plans. The bene ts in the retirement-related expense have largely been
realized and the amount of cost decrease is not expected to recur at the same magnitude in scal 2015 as compared to scal 2014.
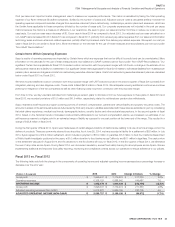
In addition to the increases in our corporate of ce expenses from pay-related expenses noted above, other sources of cost increases in scal 2014 as
compared to scal 2013 were due to increasing the capabilities of various departments within our corporate of ce. A subset of our business technology
costs has been attributable to our Business Transformation Project. Expenses related to our Business Transformation Project, inclusive of pay-related and
software amortization expense, were $277.0 million in scal 2014 and $330.5 million in scal 2013, representing a decrease of $53.5 million. The decrease
in scal 2014 resulted from a reduction in certain employee costs that were attributed to our Business Transformation Project in scal 2013 that are no
longer attributed to the Business Transformation Project in scal 2014 due to a change in allocation methodology. In scal 2013, we allocated internal
associates based upon estimates of the percentage of time they spent on the project. In scal 2014, only associates that that are dedicated full time to
the project are included in Business Transformation Project costs. Additional contributors to the decreases include an increased level of capitalization on
amounts spent for system improvements to enhance stability and scalability and reduced level of spend with consultants as compared to the comparable
period in scal 2013. The decrease in scal 2014 was partially offset by an increase in depreciation and amortization expense related to the Business
Transformation Project of $10.7 million in scal 2014 over scal 2013. We expect our corporate of ce expenses to continue to rise in scal 2015 as we
expand our corporate capabilities including a new revenue management function, organizational changes that drive greater functional support in our
broadline operations and additional investments in technology.