Sysco 2014 Annual Report Download - page 31
Download and view the complete annual report
Please find page 31 of the 2014 Sysco annual report below. You can navigate through the pages in the report by either clicking on the pages listed below, or by using the keyword search tool below to find specific information within the annual report.-
 1
1 -
2
-
3
-
4
-
5
-
6
-
7
-
8
-
9
-
10
-
11
-
12
-
13
-
14
-
15
-
16
-
17
-
18
-
19
-
20
-
 21
21 -
 22
22 -
 23
23 -
 24
24 -
 25
25 -
 26
26 -
 27
27 -
 28
28 -
 29
29 -
 30
30 -
 31
31 -
 32
32 -
 33
33 -
 34
34 -
 35
35 -
 36
36 -
 37
37 -
 38
38 -
 39
39 -
 40
40 -
 41
41 -
42
-
43
-
44
-
45
-
46
-
47
-
48
-
49
-
50
-
51
-
52
-
53
-
54
-
55
-
56
-
57
-
58
-
59
-
60
-
61
-
62
-
63
-
64
-
65
-
66
-
67
-
68
-
69
-
70
-
71
-
72
-
73
-
74
-
75
-
76
-
77
-
78
-
79
-
80
-
81
-
82
-
83
-
84
-
85
-
86
-
87
-
88
-
89
-
90
-
91
-
92
-
93
-
94
-
95
-
96
-
97
-
98
-
99
-
100
-
101
-
102
-
103
-
104
-
105
-
106
-
107
-
108
 |
 |

SYSCO CORPORATION-Form10-K 19
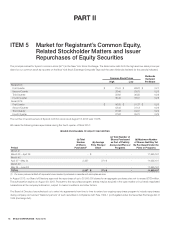
PARTII
ITEM7Management’s Discussion and Analysis ofFinancial Condition and Results of Operations
measurements of the market size periodically to align with governmental census data. As a result, our measurement used for calendar 2012 was adjusted
to 17.1%. According to industry sources, the foodservice, or food-away-from-home, market represents approximately 48% of the total dollars spent on
food purchases made at the consumer level in the U.S. as of the end of calendar 2013.
Industry sources estimate the total foodservice market in the U.S. experienced a real sales increase of approximately 1.1% in calendar year 2013 and 1.2%
in calendar year 2012. Real sales changes do not include the impact of in ation or de ation.
Highlights
The foodservice industry remained under pressure in scal 2014. While the economy continues to slowly recover, the magnitude of recovery is modest
and the outlook for certain fundamental drivers of the economy is mixed. This creates a challenging business environment for us and our customers;
however, we continue to implement transformational change on a broad scale which is enhancing the products and services we provide our customers
and helping us to operate more ef ciently. Our sales and gross pro ts grew modestly, and our expense management performance was favorable overall
despite cost pressures in our delivery operations. Our improvements largely resulted from our Business Transformation Project initiatives, which helped
drive our North American Broadline cost per case lower than in scal 2013. The impact of Certain Items also contributed to lower operating income in
scal 2014 as compared to scal 2013.
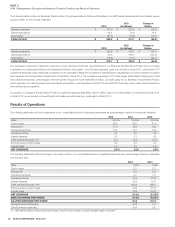
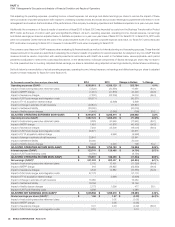
Comparison of results from scal 2014 to scal 2013:
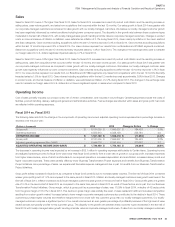
•Sales increased 4.7%, or $2.1 billion to $46.5 billion.
•Operating income decreased 4.3%, or $71.4 million, to $1.6 billion.
•Adjusted operating income decreased 0.9%, or $16.2 million, to $1.7 billion.
•Net earnings decreased 6.1%, or $60.9 million, to $0.9 billion.
•Adjusted net earnings decreased 1.8%, or $19.4 million, to $1.0 billion.
•
Basic earnings per share in scal 2014 was $1.59, a 5.4% decrease from the comparable prior year period amount of $1.68 per share. Diluted earnings
per share in scal 2014 was $1.58, a 5.4% decrease from the comparable prior year period amount of $1.67 per share.
•Adjusted diluted earnings per share was $1.76 in scal 2014, a 1.1% decrease from the comparable prior year amount of $1.78 per share.
See “Non-GAAP Reconciliations” for an explanation of these non-GAAP nancial measures.
In the second quarter of scal 2014, we announced an agreement to merge with US Foods. This merger is currently pending a regulatory review process.
Trends and Strategy
Trends
General economic conditions and consumer con dence can affect the frequency of purchases and amounts spent by consumers for food-away-from-
home and, in turn, can impact our customers and our sales. Consumers continue to spend their disposable income in an increasingly disciplined manner.
We believe these conditions have contributed to a slow rate of recovery in the foodservice market. While these trends can be cyclical in nature, greater
consumer con dence will be required to reverse the trend. According to industry sources, real sales growth for the total foodservice market in the U.S.
is expected to be modest over the long-term. We believe these industry trends reinforce the need for us to transform our business to reduce our overall
cost structure and provide greater value to our customers. Our long-term sales growth expectation is 4% to 6% annually, which assumes a modest rate
of in ation similar to historical levels.
Our gross margin performance has been in uenced by multiple factors. The modest level of growth in the foodservice market has created additional
competitive pricing pressures which is in turn negatively impacting gross pro ts. Sales to our locally-managed customers, including independent restaurant
customers, have not grown at the same rate as sales to our corporate-managed customers. Gross margin from our corporate-managed customers is
generally lower than other types of customers due to higher volumes sold to these customers. Our locally-managed customers comprise a signi cant
portion of our overall volumes and an even greater percentage of pro tability because of the high level of value added services we typically provide to this
customer group. As a result, our gross margins have declined. The disparity in the growth rate between these customer types moderated in the last half of
scal 2014 with locally-managed sales growth trending at similar rates as corporate-managed customers. In ation can be a factor that contributes to gross
margin pressure. Our in ation rates were relatively stable over the rst three quarters of scal 2014, however it increased in the fourth quarter, all quarters
being compared to the past year. Fourth quarter scal 2014 in ation was seen primarily in the meat, seafood and dairy categories which represent more
than one-third of our annual sales. While we cannot predict whether in ation will continue at current levels, periods of high in ation, either overall or in certain