Sysco 2014 Annual Report Download - page 14
Download and view the complete annual report
Please find page 14 of the 2014 Sysco annual report below. You can navigate through the pages in the report by either clicking on the pages listed below, or by using the keyword search tool below to find specific information within the annual report.-
 1
1 -
2
-
3
-
 4
4 -
 5
5 -
 6
6 -
 7
7 -
 8
8 -
 9
9 -
 10
10 -
 11
11 -
 12
12 -
 13
13 -
 14
14 -
 15
15 -
 16
16 -
 17
17 -
 18
18 -
 19
19 -
 20
20 -
 21
21 -
 22
22 -
 23
23 -
 24
24 -
25
-
26
-
27
-
28
-
29
-
30
-
31
-
32
-
33
-
34
-
35
-
36
-
37
-
38
-
39
-
40
-
41
-
42
-
43
-
44
-
45
-
46
-
47
-
48
-
49
-
50
-
51
-
52
-
53
-
54
-
55
-
56
-
57
-
58
-
59
-
60
-
61
-
62
-
63
-
64
-
65
-
66
-
67
-
68
-
69
-
70
-
71
-
72
-
73
-
74
-
75
-
76
-
77
-
78
-
79
-
80
-
81
-
82
-
83
-
84
-
85
-
86
-
87
-
88
-
89
-
90
-
91
-
92
-
93
-
94
-
95
-
96
-
97
-
98
-
99
-
100
-
101
-
102
-
103
-
104
-
105
-
106
-
107
-
108
 |
 |

SYSCO CORPORATION-Form10-K2
PARTI
ITEM1Business
Operating Segments
Sysco provides food and related products to the foodservice or food-away-from-home industry. Under the accounting provisions related to disclosures
about segments of an enterprise, we have aggregated our operating companies into a number of segments, of which only Broadline and SYGMA are
reportable segments as de ned by accounting standards. Broadline operating companies distribute a full line of food products and a wide variety of
non-food products to their customers. SYGMA operating companies distribute a full line of food products and a wide variety of non-food products
to chain restaurant customer locations. Our other segments include our specialty produce and lodging industry products segments, a company
that distributes specialty imported products, a company that distributes to international customers and the company’s Sysco Ventures platform, a
suite of technology solutions that help support the business needs of Sysco’s customers. Specialty produce companies distribute fresh produce
and, on a limited basis, other foodservice products. Our lodging industry products company distributes personal care guest amenities, equipment,
housekeeping supplies, room accessories and textiles to the lodging industry. Selected nancial data for each of our reportable segments, as well
as nancial information concerning geographic areas, can be found in Note 21, “Business Segment Information,” in the Notes to Consolidated
Financial Statements in Item 8.
Customers and Products
Sysco’s customers in the foodservice industry include restaurants, hospitals and nursing homes, schools and colleges, hotels and motels, industrial caterers
and other similar venues where foodservice products are served. Services to our customers are supported by similar physical facilities, vehicles, material
handling equipment and techniques, and administrative and operating staffs.
The products we distribute include:
•a full line of frozen foods, such as meats, seafood, fully prepared entrees, fruits, vegetables and desserts;
•a full line of canned and dry foods;
•fresh meats and seafood;
•dairy products;
•beverage products;
•imported specialties; and
•fresh produce.
We also supply a wide variety of non-food items, including:
•paper products such as disposable napkins, plates and cups;
•tableware such as china and silverware;
•cookware such as pots, pans and utensils;
•restaurant and kitchen equipment and supplies; and
•cleaning supplies.
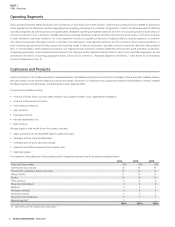
A comparison of the sales mix in the principal product categories during the last three years is presented below:
2014 2013 2012
Fresh and frozen meats 19% 19% 19%
Canned and dry products 18 19 19
Frozen fruits, vegetables, bakery and other 13 14 14
Dairy products 11 10 10
Poultry 10 10 10
Fresh produce 8 8 8
Paper and disposables 7 8 8
Seafood 5 5 5
Beverage products 4 4 4
Janitorial products 2 2 2
Equipment and smallwares 2 1 1
Medical supplies(1) 1 - -
100% 100% 100%
(1) Sales are less than 1% of total for years shown with a “-”.