Sysco 2014 Annual Report Download - page 34
Download and view the complete annual report
Please find page 34 of the 2014 Sysco annual report below. You can navigate through the pages in the report by either clicking on the pages listed below, or by using the keyword search tool below to find specific information within the annual report.-
 1
1 -
2
-
3
-
4
-
5
-
6
-
7
-
8
-
9
-
10
-
11
-
12
-
13
-
14
-
15
-
16
-
17
-
18
-
19
-
20
-
21
-
22
-
23
-
 24
24 -
 25
25 -
 26
26 -
 27
27 -
 28
28 -
 29
29 -
 30
30 -
 31
31 -
 32
32 -
 33
33 -
 34
34 -
 35
35 -
 36
36 -
 37
37 -
 38
38 -
 39
39 -
 40
40 -
 41
41 -
 42
42 -
 43
43 -
 44
44 -
45
-
46
-
47
-
48
-
49
-
50
-
51
-
52
-
53
-
54
-
55
-
56
-
57
-
58
-
59
-
60
-
61
-
62
-
63
-
64
-
65
-
66
-
67
-
68
-
69
-
70
-
71
-
72
-
73
-
74
-
75
-
76
-
77
-
78
-
79
-
80
-
81
-
82
-
83
-
84
-
85
-
86
-
87
-
88
-
89
-
90
-
91
-
92
-
93
-
94
-
95
-
96
-
97
-
98
-
99
-
100
-
101
-
102
-
103
-
104
-
105
-
106
-
107
-
108
 |
 |

SYSCO CORPORATION-Form10-K22
PARTII
ITEM7Management’s Discussion and Analysis ofFinancial Condition and Results of Operations
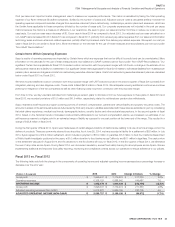
The following tables outline our Business Transformation Project expenditures, that are attributable to our ERP system implementation and shared service
support center, for the periods presented:
2014
2013
(In millions)
Change in
Dollars
Operating expense $ 277.0 $ 330.5 $ (53.5)
Capital expenditure 33.4 20.0 13.4
Amortization (87.5) (76.8) (10.7)
CASH OUTLAY $ 222.9 $ 273.7 $ (50.8)
2013
2012
(In millions)
Change in
Dollars
Operating expense $ 330.5 $ 193.1 $ 137.4
Capital expenditure 20.0 146.2 (126.2)
Amortization (76.8) (17.1) (59.7)
CASH OUTLAY $ 273.7 $ 322.2 $ (48.5)
The decrease in expenses in scal 2014 was due to lower employee costs that were attributed to our Business Transformation Project due to a change
in allocation for employees that are not dedicated full time to the project. Only full time employee costs are included in scal 2014, while scal 2013
included all employee costs. Additional contributors to the decrease in scal 2014 include an increased level of capitalization on amounts spent for system
improvements and reduced level of spend with consultants in scal 2014. The increase in expenses in 2013 was largely attributable to deployment costs
and software amortization, which began in the rst quarter of scal 2013 and totaled $76.8 million. Our cash outlay for our Business Transformation Project,
which excludes non-cash expenses such as software amortization, has decreased in scal 2014 and scal 2013 primarily due to lower levels of spend on
internal labor and consultants.
Our goal for our Business Transformation Project is to generate approximately $550 million to $650 million in annual bene ts to be achieved by scal 2015.
In scal 2014, we exceeded our bene t goals and believe we will exceed our goals again in scal 2015.
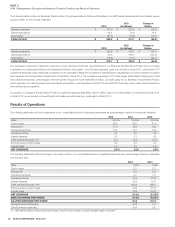
Results of Operations
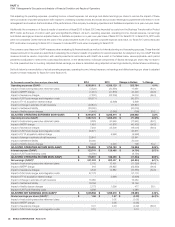
The following table sets forth the components of our consolidated results of operations expressed as a percentage of sales for the periods indicated:
2014 2013 2012
Sales 100.0% 100.0% 100.0%
Cost of sales 82.4 82.0 81.6
Gross pro t 17.6 18.0 18.4
Operating expenses 14.2 14.3 13.9
Operating income 3.4 3.7 4.5
Interest expense 0.2 0.3 0.3
Other expense (income), net (0.0) (0.0) (0.0)
Earnings before income taxes 3.2 3.4 4.2
Income taxes 1.2 1.2 1.6
NET EARNINGS 2.0% 2.2% 2.6%
The following table sets forth the change in the components of our consolidated results of operations expressed as a percentage increase or decrease
over the prior year:
2014 2013
Sales 4.7% 4.8%
Cost of sales 5.3 5.2
Gross pro t 2.3 2.8
Operating expenses 4.0 7.6
Operating income (4.3) (12.3)
Interest expense (3.7) 13.3
Other expense (income), net(1) (29.9) 158.2
Earnings before income taxes (4.6) (13.3)
Income taxes (2.0) (16.2)
NET EARNINGS (6.1)% (11.5)%
BASIC EARNINGS PER SHARE (5.4)% (12.0)%
DILUTED EARNINGS PER SHARE (5.4) (12.1)
Averageshares outstanding (0.6) 0.3
Dilutedshares outstanding (0.4) 0.6
(1) Other expense (income), net was income of $12.2 million in fiscal 2014, $17.5 million in fiscal 2013 and $6.8 million in fiscal 2012.