Sysco 2014 Annual Report Download - page 101
Download and view the complete annual report
Please find page 101 of the 2014 Sysco annual report below. You can navigate through the pages in the report by either clicking on the pages listed below, or by using the keyword search tool below to find specific information within the annual report.-
 1
1 -
2
-
3
-
4
-
5
-
6
-
7
-
8
-
9
-
10
-
11
-
12
-
13
-
14
-
15
-
16
-
17
-
18
-
19
-
20
-
21
-
22
-
23
-
24
-
25
-
26
-
27
-
28
-
29
-
30
-
31
-
32
-
33
-
34
-
35
-
36
-
37
-
38
-
39
-
40
-
41
-
42
-
43
-
44
-
45
-
46
-
47
-
48
-
49
-
50
-
51
-
52
-
53
-
54
-
55
-
56
-
57
-
58
-
59
-
60
-
61
-
62
-
63
-
64
-
65
-
66
-
67
-
68
-
69
-
70
-
71
-
72
-
73
-
74
-
75
-
76
-
77
-
78
-
79
-
80
-
81
-
82
-
83
-
84
-
85
-
86
-
87
-
88
-
89
-
90
-
 91
91 -
 92
92 -
 93
93 -
 94
94 -
 95
95 -
 96
96 -
 97
97 -
 98
98 -
 99
99 -
 100
100 -
 101
101 -
 102
102 -
 103
103 -
 104
104 -
 105
105 -
 106
106 -
 107
107 -
 108
108
 |
 |

SYSCO CORPORATION-Form10-K 89
PARTII
ITEM8Financial Statements and Supplementary Data
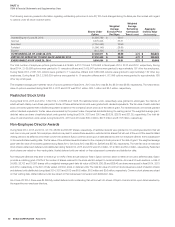
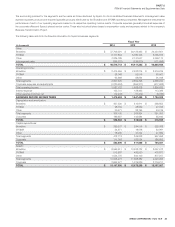
(Inthousands)
Condensed Consolidating Cash Flows
Year Ended June 28, 2014
Sysco
Certain U.S.
Broadline
Subsidiaries
Other Non-
Guarantor
Subsidiaries
Consolidated
Totals
Net cash provided by (used for):
Operating activities $ (504,119) $ 1,541,062 $ 455,872 $ 1,492,815
Investing activities (51,290) (171,979) (353,569) (576,838)
Financing activities (919,627) 3,872 (103) (915,858)
Effect of exchange rate on cash - - 642 642
Intercompany activity 1,426,402 (1,369,478) (56,924) -
Net increase (decrease) in cash and cash equivalents (48,634) 3,477 45,918 761
Cash and cash equivalents at beginning of the period 207,591 24,295 180,399 412,285
CASH AND CASH EQUIVALENTS AT END OF THE PERIOD $ 158,957 $ 27,772 $ 226,317 $ 413,046
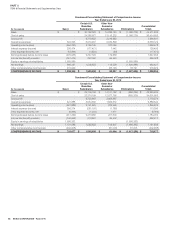
(Inthousands)
Condensed Consolidating Cash Flows
Year Ended June 29, 2013
Sysco
Certain U.S.
Broadline
Subsidiaries
Other Non-
Guarantor
Subsidiaries
Consolidated
Totals
Net cash provided by (used for):
Operating activities $ (449,417) $ 1,705,950 $ 255,061 $ 1,511,594
Investing activities (105,314) (140,217) (666,351) (911,882)
Financing activities (887,707) (15,666) 29,165 (874,208)
Effect of exchange rate on cash - - (2,086) (2,086)
Intercompany activity 1,178,922 (1,560,250) 381,328 -
Net increase (decrease) in cash and cash equivalents (263,516) (10,183) (2,883) (276,582)
Cash and cash equivalents at beginning of the period 471,107 34,478 183,282 688,867
CASH AND CASH EQUIVALENTS AT END OF THE PERIOD $ 207,591 $ 24,295 $ 180,399 $ 412,285
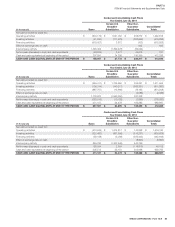
(Inthousands)
Condensed Consolidating Cash Flows
Year Ended June 30, 2012
Sysco
Certain U.S.
Broadline
Subsidiaries
Other Non-
Guarantor
Subsidiaries
Consolidated
Totals
Net cash provided by (used for):
Operating activities $ (413,535) $ 1,674,817 $ 142,898 $ 1,404,180
Investing activities (222,483) (367,909) (313,237) (903,629)
Financing activities (58,168) (2,038) (382,443) (442,649)
Effect of exchange rate on cash - - (8,800) (8,800)
Intercompany activity 859,780 (1,302,546) 442,766 -
Net increase (decrease) in cash and cash equivalents 165,594 2,324 (118,816) 49,102
Cash and cash equivalents at beginning of the period 305,513 32,154 302,098 639,765
CASH AND CASH EQUIVALENTS AT END OF THE PERIOD $ 471,107 $ 34,478 $ 183,282 $ 688,867