Sysco 2014 Annual Report Download - page 99
Download and view the complete annual report
Please find page 99 of the 2014 Sysco annual report below. You can navigate through the pages in the report by either clicking on the pages listed below, or by using the keyword search tool below to find specific information within the annual report.-
 1
1 -
2
-
3
-
4
-
5
-
6
-
7
-
8
-
9
-
10
-
11
-
12
-
13
-
14
-
15
-
16
-
17
-
18
-
19
-
20
-
21
-
22
-
23
-
24
-
25
-
26
-
27
-
28
-
29
-
30
-
31
-
32
-
33
-
34
-
35
-
36
-
37
-
38
-
39
-
40
-
41
-
42
-
43
-
44
-
45
-
46
-
47
-
48
-
49
-
50
-
51
-
52
-
53
-
54
-
55
-
56
-
57
-
58
-
59
-
60
-
61
-
62
-
63
-
64
-
65
-
66
-
67
-
68
-
69
-
70
-
71
-
72
-
73
-
74
-
75
-
76
-
77
-
78
-
79
-
80
-
81
-
82
-
83
-
84
-
85
-
86
-
87
-
88
-
 89
89 -
 90
90 -
 91
91 -
 92
92 -
 93
93 -
 94
94 -
 95
95 -
 96
96 -
 97
97 -
 98
98 -
 99
99 -
 100
100 -
 101
101 -
 102
102 -
 103
103 -
 104
104 -
 105
105 -
 106
106 -
 107
107 -
 108
108
 |
 |

SYSCO CORPORATION-Form10-K 87
PARTII
ITEM8Financial Statements and Supplementary Data
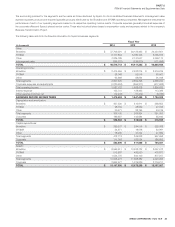
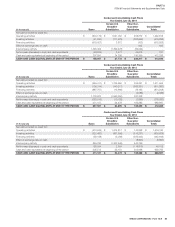
The following condensed consolidating nancial statements present separately the nancial position, comprehensive income and cash ows of the parent
issuer (Sysco Corporation), the guarantors (the majority of Sysco’s U.S. Broadline subsidiaries) and all other non-guarantor subsidiaries of Sysco (Other
Non-Guarantor Subsidiaries) on a combined basis with eliminating entries.
(Inthousands)
Condensed Consolidating Balance Sheet
June 28, 2014
Sysco
Certain U.S.
Broadline
Subsidiaries
Other Non-
Guarantor
Subsidiaries Eliminations
Consolidated
Totals
Current assets $ 254,766 $ 3,928,660 $ 2,498,546 $ - $ 6,681,972
Investment in subsidiaries 8,013,214 - - (8,013,214) -
Plant and equipment, net 496,953 1,783,262 1,705,403 - 3,985,618
Other assets 344,045 524,468 1,631,847 - 2,500,360
TOTAL ASSETS $ 9,108,978 $ 6,236,390 $ 5,835,796 $ (8,013,214) $ 13,167,950
Current liabilities $ 793,240 $ 1,008,366 $ 2,566,024 $ - $ 4,367,630
Intercompany payables (receivables) 20,107 (239,539) 219,432 - -
Long-term debt 2,348,558 14,094 21,515 - 2,384,167
Other liabilities 680,378 328,185 140,895 - 1,149,458
Shareholders’ equity 5,266,695 5,125,284 2,887,930 (8,013,214) 5,266,695
TOTAL LIABILITIES AND SHAREHOLDERS’ EQUITY $ 9,108,978 $ 6,236,390 $ 5,835,796 $ (8,013,214) $ 13,167,950
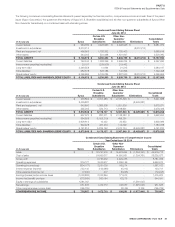
(Inthousands)
Condensed Consolidating Balance Sheet
June 29, 2013
Sysco
Certain U.S.
Broadline
Subsidiaries
Other Non-
Guarantor
Subsidiaries Eliminations
Consolidated
Totals
Current assets $ 276,856 $ 3,757,486 $ 2,187,346 $ - $ 6,221,688
Investment in subsidiaries 8,429,887 - - (8,429,887) -
Plant and equipment, net 540,860 1,885,908 1,551,303 - 3,978,071
Other assets 325,045 534,713 1,618,691 - 2,478,449
TOTAL ASSETS $ 9,572,648 $ 6,178,107 $ 5,357,340 $ (8,429,887) $ 12,678,208
Current liabilities $ 637,070 $ 887,271 $ 2,138,283 $ - $ 3,662,624
Intercompany payables (receivables) 594,928 (1,003,219) 408,291 - -
Long-term debt 2,606,612 10,422 22,952 - 2,639,986
Other liabilities 542,228 467,470 174,090 - 1,183,788
Shareholders’ equity 5,191,810 5,816,163 2,613,724 (8,429,887) 5,191,810
TOTAL LIABILITIES AND SHAREHOLDERS’ EQUITY $ 9,572,648 $ 6,178,107 $ 5,357,340 $ (8,429,887) $ 12,678,208
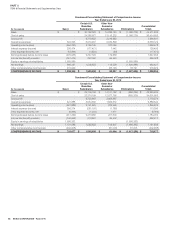
(Inthousands)
Condensed Consolidating Statement of Comprehensive Income
Year Ended June 28, 2014
Sysco
Certain U.S.
Broadline
Subsidiaries
Other Non-
Guarantor
Subsidiaries Eliminations
Consolidated
Totals
Sales $ - $ 30,741,979 $ 16,979,494 $ (1,204,761) $ 46,516,712
Cost of sales - 24,990,377 14,550,061 (1,204,761) 38,335,677
Gross pro t - 5,751,602 2,429,433 - 8,181,035
Operating expenses 804,177 3,520,577 2,269,159 - 6,593,913
Operating income (loss) (804,177) 2,231,025 160,274 - 1,587,122
Interest expense (income) 232,140 (102,086) (6,313) - 123,741
Other expense (income), net (7,434) 217 (5,026) - (12,243)
Earnings (losses) before income taxes (1,028,883) 2,332,894 171,613 - 1,475,624
Income tax (bene t) provision (379,369) 860,184 63,276 - 544,091
Equity in earnings of subsidiaries 1,581,047 - - (1,581,047) -
Net earnings 931,533 1,472,710 108,337 (1,581,047) 931,533
Other comprehensive income (loss) (195,726) - (3,106) 3,106 (195,726)
COMPREHENSIVE INCOME $ 735,807 $ 1,472,710 $ 105,231 $ (1,577,941) $ 735,807