Sysco 2014 Annual Report Download - page 102
Download and view the complete annual report
Please find page 102 of the 2014 Sysco annual report below. You can navigate through the pages in the report by either clicking on the pages listed below, or by using the keyword search tool below to find specific information within the annual report.-
 1
1 -
2
-
3
-
4
-
5
-
6
-
7
-
8
-
9
-
10
-
11
-
12
-
13
-
14
-
15
-
16
-
17
-
18
-
19
-
20
-
21
-
22
-
23
-
24
-
25
-
26
-
27
-
28
-
29
-
30
-
31
-
32
-
33
-
34
-
35
-
36
-
37
-
38
-
39
-
40
-
41
-
42
-
43
-
44
-
45
-
46
-
47
-
48
-
49
-
50
-
51
-
52
-
53
-
54
-
55
-
56
-
57
-
58
-
59
-
60
-
61
-
62
-
63
-
64
-
65
-
66
-
67
-
68
-
69
-
70
-
71
-
72
-
73
-
74
-
75
-
76
-
77
-
78
-
79
-
80
-
81
-
82
-
83
-
84
-
85
-
86
-
87
-
88
-
89
-
90
-
91
-
 92
92 -
 93
93 -
 94
94 -
 95
95 -
 96
96 -
 97
97 -
 98
98 -
 99
99 -
 100
100 -
 101
101 -
 102
102 -
 103
103 -
 104
104 -
 105
105 -
 106
106 -
 107
107 -
 108
108
 |
 |
SYSCO CORPORATION-Form10-K90
PARTII
ITEM8Financial Statements and Supplementary Data
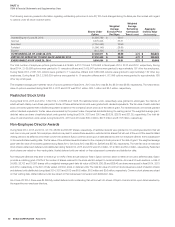
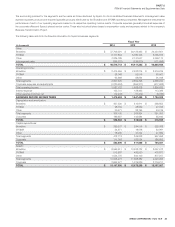
NOTE23 Quarterly Results (Unaudited)
Financial information for each quarter in the years ended June 28, 2014 and June 29, 2013 is set forth below:
(Inthousands except for per share data)
Fiscal 2014 Quarter Ended
Fiscal YearSeptember28 December28 March29 June28
Sales $ 11,714,267 $ 11,237,969 $ 11,277,484 $ 12,286,992 $ 46,516,712
Cost of sales 9,648,780 9,273,018 9,282,743 10,131,136 38,335,677
Gross pro t 2,065,487 1,964,951 1,994,741 2,155,856 8,181,035
Operating expenses 1,587,289 1,613,174 1,662,116 1,731,334 6,593,913
Operating income 478,198 351,777 332,625 424,522 1,587,122
Interest expense 30,528 29,784 32,224 31,205 123,741
Other expense (income), net (4,534) (4,211) 3,718 (7,216) (12,243)
Earnings before income taxes 452,204 326,204 296,683 400,533 1,475,624
Income taxes 166,614 115,369 115,746 146,362 544,091
NET EARNINGS $ 285,590 $ 210,835 $ 180,937 $ 254,171 $ 931,533
Per share:
BASIC NET EARNINGS $ 0.49 $ 0.36 $ 0.31 $ 0.43 $ 1.59
DILUTED NET EARNINGS 0.48 0.36 0.31 0.43 1.58
Dividends declared 0.28 0.29 0.29 0.29 1.15
Market price — high/low 36-31 43-31 37-34 38-35 43-31
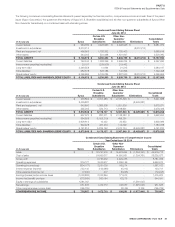
(Inthousands except for per share data)
Fiscal 2013 Quarter Ended
Fiscal YearSeptember 29 December 29 March 30 June29
Sales $ 11,086,916 $ 10,796,890 $ 10,926,371 $ 11,601,056 $ 44,411,233
Cost of sales 9,057,121 8,844,780 8,983,889 9,528,836 36,414,626
Gross pro t 2,029,795 1,952,110 1,942,482 2,072,220 7,996,607
Operating expenses 1,551,013 1,569,459 1,605,280 1,612,377 6,338,129
Operating income 478,782 382,651 337,202 459,843 1,658,478
Interest expense 30,868 32,242 34,215 31,170 128,495
Other (income), net (2,477) (1,753) (3,410) (9,832) (17,472)
Earnings before income taxes 450,391 352,162 306,397 438,505 1,547,455
Income taxes 163,793 130,793 104,980 155,462 555,028
NET EARNINGS $ 286,598 $ 221,369 $ 201,417 $ 283,043 $ 992,427
Per share:
BASIC NET EARNINGS $ 0.49 $ 0.38 $ 0.34 $ 0.48 $ 1.68
DILUTED NET EARNINGS 0.49 0.38 0.34 0.47 1.67
Dividends declared 0.27 0.28 0.28 0.28 1.11
Market price — high/low 31-28 32-30 36-31 35-33 36-28
PERCENTAGE CHANGE— 2014 VS. 2013:
Quarter 1 Quarter 2 Quarter 3 Quarter 4 Fiscal Year
Sales 6% 4% 3% 6% 5%
Operating income - (8) (1) (8) (4)
Net earnings - (5) (10) (10) (6)
Basic net earnings per share - (5) (9) (10) (5)
Diluted net earnings per share (2) (5) (9) (9) (5)
Financial results are impacted by accounting changes and the adoption of various accounting standards. See Note 2, “Changes in Accounting.”