Target 2010 Annual Report Download - page 20
Download and view the complete annual report
Please find page 20 of the 2010 Target annual report below. You can navigate through the pages in the report by either clicking on the pages listed below, or by using the keyword search tool below to find specific information within the annual report.-
 1
1 -
2
-
3
-
4
-
5
-
6
-
7
-
8
-
9
-
 10
10 -
 11
11 -
 12
12 -
 13
13 -
 14
14 -
 15
15 -
 16
16 -
 17
17 -
 18
18 -
 19
19 -
 20
20 -
 21
21 -
 22
22 -
 23
23 -
 24
24 -
 25
25 -
 26
26 -
 27
27 -
 28
28 -
 29
29 -
 30
30 -
31
-
32
-
33
-
34
-
35
-
36
-
37
-
38
-
39
-
40
-
41
-
42
-
43
-
44
-
45
-
46
-
47
-
48
-
49
-
50
-
51
-
52
-
53
-
54
-
55
-
56
-
57
-
58
-
59
-
60
-
61
-
62
-
63
-
64
-
65
-
66
-
67
-
68
-
69
-
70
-
71
-
72
-
73
-
74
-
75
-
76
-
77
-
78
-
79
-
80
-
81
-
82
-
83
-
84
-
85
-
86
-
87
-
88
-
89
-
90
-
91
-
92
-
93
-
94
-
95
-
96
-
97
-
98
-
99
-
100
-
101
-
102
-
103
 |
 |

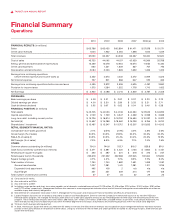
18 TARGET 2010 ANNUAL REPORT
2010 2009 2008 2007 2006 (a) 2005
FINANCIAL RESULTS: (in millions)
Sales $ 65,786 $ 63,435 $ 62,884 $ 61,471 $ 57,878 $ 51,271
Credit card revenues 1,604 1,922 2,064 1,896 1,612 1,349
Total revenues 67,390 65,357 64,948 63,367 59,490 52,620
Cost of sales 45,725 44,062 44,157 42,929 40,366 35,788
Selling, general and administrative expenses (b)
13,469 13,078 12,954 12,670 11,8 52 10,324
Credit card expenses 860 1,521 1,609 837 707 776
Depreciation and amortization 2,084 2,023 1,826 1,659 1,496 1,409
Earnings from continuing operations
before interest expense and income taxes (c)
5,252 4,673 4,402 5,272 5,069 4,323
Net interest expense 757 801 866 647 572 463
Earnings from continuing operations before income taxes 4,495 3,872 3,536 4,625 4,497 3,860
Provision for income taxes 1,575 1,384 1,322 1,776 1,710 1,452
Net Earnings $ 2,920 $ 2,488 $ 2,214 $ 2,849 $ 2,787 $ 2,408
PER SHARE:
Basic earnings per share $ 4.03 $ 3.31 $ 2.87 $ 3.37 $ 3.23 $ 2.73
Diluted earnings per share $ 4.00 $ 3.30 $ 2.86 $ 3.33 $ 3.21 $ 2.71
Cash dividends declared $ 0.92 $ 0.67 $ 0.62 $ 0.54 $ 0.46 $ 0.38
FINANCIAL POSITION: (in millions)
Total assets $ 43,705 $ 44,533 $ 44,106 $ 44,560 $ 37,349 $ 34,995
Capital expenditures $ 2,129 $ 1,729 $ 3,547 $ 4,369 $ 3,928 $ 3,388
Long-term debt, including current portion $ 15,726 $ 16,814 $ 18,752 $ 16,590 $ 10,037 $ 9,872
Net debt (d) $ 14,597 $ 15,288 $ 18,562 $ 15,238 $ 9,756 $ 8,700
Shareholders’ investment $ 15,487 $ 15,347 $ 13,712 $ 15,307 $ 15,633 $ 14,205
RETAIL SEGMENT FINANCIAL RATIOS:
Comparable-store sales growth (e) 2.1% (2.5%) (2.9%) 3.0% 4.8% 5.6%
Gross margin (% of sales) 30.5% 30.5% 29.8% 30.2% 30.3% 30.2%
SG&A (% of sales) (f) 20.3% 20.5% 20.4% 20.4% 20.3% 19.9%
EBIT margin (% of sales) 7.0% 6.9% 6.5% 7.1% 7.4% 7. 5%
OTHER:
Common shares outstanding (in millions) 704.0 744.6 752.7 818.7 8 59.8 874.1
Cash flow provided by operations (in millions) $ 5,271 $ 5,881 $ 4,430 $ 4,125 $ 4,862 $ 4,451
Revenuespersquarefoot(g)(h) $ 290 $ 287 $ 301 $ 318 $ 316 $ 307
Retailsquarefeet(inthousands) 233,618 231,952 222,588 207,945 192,064 178,260
Square footage growth 0.7% 4.2% 7.0% 8.3% 7.7% 8.0%
Total number of stores 1,750 1,740 1,682 1,591 1,488 1,397
General merchandise 1,037 1,381 1,441 1,381 1,311 1,239
Expanded food assortment 462 108 2 n/a n/a n/a
SuperTarget 251 251 239 210 177 158
Total number of distribution centers 37 37 34 32 29 26
(a) Consisted of 53 weeks.
(b) Also referred to as SG&A.
(c) Also referred to as EBIT.
(d) Including current portion and short-term notes payable, net of domestic marketable securities of $1,129 million, $1,526 million, $190 million, $1,851 million, $281 million,
and $1,172 million, respectively. Management believes this measure is a more appropriate indicator of our level of financial leverage because marketable securities are
available to pay debt maturity obligations.
(e) Seedefinitionofcomparable-storesalesinItem7,Management’sDiscussionandAnalysisofFinancialConditionandResultsofOperations.
(f) LoyaltyProgramdiscountsarerecordedasreductionstosalesinourRetailSegment.EffectivewiththeOctober2010nationwidelaunchofournew5%REDcard
Rewardsloyaltyprogram,wechangedtheformulaunderwhichourCreditCardsegmentreimbursesourRetailSegmenttobetteralignwiththeattributesofthenew
program. These reimbursed amounts were $102 million, $89 million, $117 million, $114 million, $109 million, and $98 million, respectively. In all periods these amounts
wererecordedasreductionstoSG&AexpenseswithintheRetailSegmentandincreasestooperationsandmarketingexpenseswithintheCreditCardSegment.
(g) Thirteen-month average retail square feet.
(h)
In 2006, revenues per square foot were calculated with 52 weeks of revenues (the 53rd week of revenues was excluded) because management believes that these numbers
provide a more useful analytical comparison to other years. Using our revenues for the 53-week year under generally accepted accounting principles, 2006 revenues per
square foot were $322.
Financial Summary
Operations