Target 2010 Annual Report Download - page 39
Download and view the complete annual report
Please find page 39 of the 2010 Target annual report below. You can navigate through the pages in the report by either clicking on the pages listed below, or by using the keyword search tool below to find specific information within the annual report.-
 1
1 -
2
-
3
-
4
-
5
-
6
-
7
-
8
-
9
-
10
-
11
-
12
-
13
-
14
-
15
-
16
-
17
-
18
-
19
-
20
-
21
-
22
-
23
-
24
-
25
-
26
-
27
-
28
-
 29
29 -
 30
30 -
 31
31 -
 32
32 -
 33
33 -
 34
34 -
 35
35 -
 36
36 -
 37
37 -
 38
38 -
 39
39 -
 40
40 -
 41
41 -
 42
42 -
 43
43 -
 44
44 -
 45
45 -
 46
46 -
 47
47 -
 48
48 -
 49
49 -
50
-
51
-
52
-
53
-
54
-
55
-
56
-
57
-
58
-
59
-
60
-
61
-
62
-
63
-
64
-
65
-
66
-
67
-
68
-
69
-
70
-
71
-
72
-
73
-
74
-
75
-
76
-
77
-
78
-
79
-
80
-
81
-
82
-
83
-
84
-
85
-
86
-
87
-
88
-
89
-
90
-
91
-
92
-
93
-
94
-
95
-
96
-
97
-
98
-
99
-
100
-
101
-
102
-
103
 |
 |

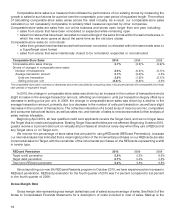
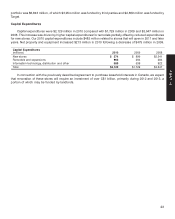
difference between an item’s cost and its retail price (expressed as a percentage of its retail price). Factors that
affect markup include vendor offerings and negotiations, vendor income, sourcing strategies, market forces like
raw material and freight costs, and competitive influences. Markdowns are the reduction in the original or previous
price of retail merchandise. Factors that affect markdowns include inventory management, competitive influences
and economic conditions.
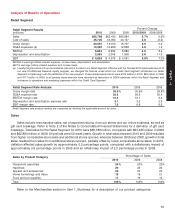
Our gross margin rate was 30.5 percent in 2010, unchanged from prior year, as margin rates within categories
were generally stable and the impact of sales mix was essentially neutral. There were no other significant variances
in the drivers of gross margin rate.
Our gross margin rate was 30.5 percent in 2009, compared with 29.8 percent in 2008. Our 2009 gross margin
rate benefitted from rate improvements within categories, partially offset by the mix impact of faster sales growth in
lower margin rate categories (generally product categories of household essentials and food). The impact of rate
performance within merchandise categories on gross margin rate was an approximate 1.1 percentage point
increase for 2009. This increase is the result of improved markups and reduced markdowns. The impact of sales
mix on gross margin rate was an approximate 0.4 percentage point reduction.
Selling, General and Administrative Expense Rate
Our selling, general and administrative (SG&A) expense rate represents SG&A expenses as a percentage of
sales. See Note 3 of the Notes to Consolidated Financial Statements for a description of costs included in SG&A
expenses. SG&A expenses exclude depreciation and amortization, as well as expenses associated with our credit
card operations, which are reflected separately in our Consolidated Statements of Operations.
SG&A expense rate was 20.3 percent in 2010 compared with 20.5 percent in 2009 and 20.4 percent in 2008.
The change in the rate in 2010 was primarily due to favorable leverage of overall compensation expenses. The
change in the SG&A expense rate in 2009 was primarily driven by an approximate 0.4 percentage point impact from
an increase in incentive compensation due to better than expected 2009 performance compared with 2008 results,
which was partially offset by an approximate 0.2 percentage point impact from sustained productivity gains in our
stores.
Depreciation and Amortization Expense Rate
Our depreciation and amortization expense rate represents depreciation and amortization expense as a
percentage of sales. In 2010, our depreciation and amortization expense rate was 3.1 percent compared with
3.2 percent in 2009 and 2.9 percent in 2008. The rate was essentially unchanged from the same period last year. In
2009 the increase in the rate was primarily due to accelerated depreciation on assets that were replaced as part of
our remodel program.
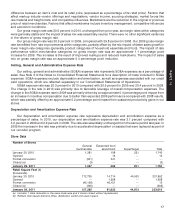
Store Data
Number of Stores
General Expanded food
merchandise assortment SuperTarget Total
January 30, 2010 1,381 108 251 1,740
Opened — 13 — 13
Format conversion (341) 341 — —
Closed (a) (3) — — (3)
January 29, 2011 1,037 462 251 1,750
Retail Square Feet (b)
(thousands)
January 30, 2010 172,735 14,714 44,503 231,952
Opened — 1,958 — 1,958
Format conversion (45,138) 45,151 — 13
Closed (a) (305) — — (305)
January 29, 2011 127,292 61,823 44,503 233,618
(a) Includes 1 store relocation in the same trade area and 2 stores closed without replacement.
(b) Reflects total square feet less office, distribution center and vacant space.
17
PART II