Target 2010 Annual Report Download - page 70
Download and view the complete annual report
Please find page 70 of the 2010 Target annual report below. You can navigate through the pages in the report by either clicking on the pages listed below, or by using the keyword search tool below to find specific information within the annual report.-
 1
1 -
2
-
3
-
4
-
5
-
6
-
7
-
8
-
9
-
10
-
11
-
12
-
13
-
14
-
15
-
16
-
17
-
18
-
19
-
20
-
21
-
22
-
23
-
24
-
25
-
26
-
27
-
28
-
29
-
30
-
31
-
32
-
33
-
34
-
35
-
36
-
37
-
38
-
39
-
40
-
41
-
42
-
43
-
44
-
45
-
46
-
47
-
48
-
49
-
50
-
51
-
52
-
53
-
54
-
55
-
56
-
57
-
58
-
59
-
 60
60 -
 61
61 -
 62
62 -
 63
63 -
 64
64 -
 65
65 -
 66
66 -
 67
67 -
 68
68 -
 69
69 -
 70
70 -
 71
71 -
 72
72 -
 73
73 -
 74
74 -
 75
75 -
 76
76 -
 77
77 -
 78
78 -
 79
79 -
 80
80 -
81
-
82
-
83
-
84
-
85
-
86
-
87
-
88
-
89
-
90
-
91
-
92
-
93
-
94
-
95
-
96
-
97
-
98
-
99
-
100
-
101
-
102
-
103
 |
 |

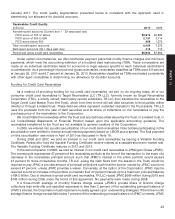
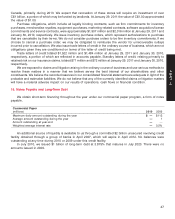
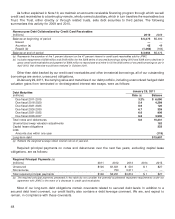
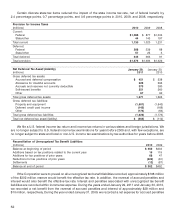
As further explained in Note 10, we maintain an accounts receivable financing program through which we sell
credit card receivables to a bankruptcy remote, wholly owned subsidiary, which in turn transfers the receivables to a
Trust. The Trust, either directly or through related trusts, sells debt securities to third parties. The following
summarizes this activity for 2009 and 2010.
Nonrecourse Debt Collateralized by Credit Card Receivables
(millions) 2010 2009
Balance at beginning of period $ 5,375 $5,490
Issued ——
Accretion (a) 45 48
Repaid (b) (1,466) (163)
Balance at end of period $ 3,954 $5,375
(a) Represents the accretion of the 7 percent discount on the 47 percent interest in credit card receivables sold to JPMC.
(b) Includes repayments of $566 million and $163 million for the 2008 series of secured borrowings during 2010 and 2009 due to declines in
gross credit card receivables and payment of $900 million to repurchase and retire in full the 2005 series of secured borrowings at par in
April 2010, that otherwise would have matured in October 2010.
Other than debt backed by our credit card receivables and other immaterial borrowings, all of our outstanding
borrowings are senior, unsecured obligations.
At January 29, 2011, the carrying value and maturities of our debt portfolio, including unamortized hedged debt
valuation gains from terminated or de-designated interest rate swaps, were as follows:
January 29, 2011
Debt Maturities
(millions) Rate (a) Balance
Due fiscal 2011-2015 3.2% $ 6,090
Due fiscal 2016-2020 5.4 4,299
Due fiscal 2021-2025 8.9 120
Due fiscal 2026-2030 6.7 326
Due fiscal 2031-2035 6.6 906
Due fiscal 2036-2037 6.8 3,500
Total notes and debentures 5.0 15,241
Unamortized swap valuation adjustments 152
Capital lease obligations 333
Less:
Amounts due within one year (119)
Long-term debt $15,607
(a) Reflects the weighted average stated interest rate as of year-end.
Required principal payments on notes and debentures over the next five years, excluding capital lease
obligations, are as follows:
Required Principal Payments (a)
(millions) 2011 2012 2013 2014 2015
Unsecured $106 $1,501 $ 501 $ 1 $27
Nonrecourse — 750 3,311 — —
Total required principal payments $106 $2,251 $3,812 $ 1 $27
(a) The required principal payments presented in this table do not consider the potential accelerated repayment requirements under our
agreement with JPMC in the event of a decrease in credit card receivables.
Most of our long-term debt obligations contain covenants related to secured debt levels. In addition to a
secured debt level covenant, our credit facility also contains a debt leverage covenant. We are, and expect to
remain, in compliance with these covenants.
48